In fiscal year 2024–25, the University of California Office of the President (UCOP) sharpened its decarbonization plan by strengthening data quality.
UCOP completed waste audits at Franklin and UC Path/Intellicenter to verify tonnage and pinpoint diversion gaps and in March 2025 conducted its first Employee Commuter Survey since 2018, giving a clearer post-pandemic picture of commute emissions.
Read More about Sustainability at UC office of the president
With fuller, more accurate data, reported scope 3 emissions rose significantly since fiscal year 2023–24, driven mainly by improved commuter accounting, even as the long-term trajectory remains downward. Compared to last year, transportation indicators show single-occupancy-vehicle trips up by under 3% and telecommuting down 12%, partly offset by higher transit, carpool, bike and walk shares. Waste generation fell in total and per capita terms, but diversion slipped by one point. Audits found contamination and missed capture, prompting initial operational changes, including adoption of improved paper towel composting. With this stronger baseline, UCOP will pivot from measurement to action — identifying, piloting and scaling solutions that close diversion gaps and cut travel emissions to advance our sustainability and decarbonization goals.
Stories
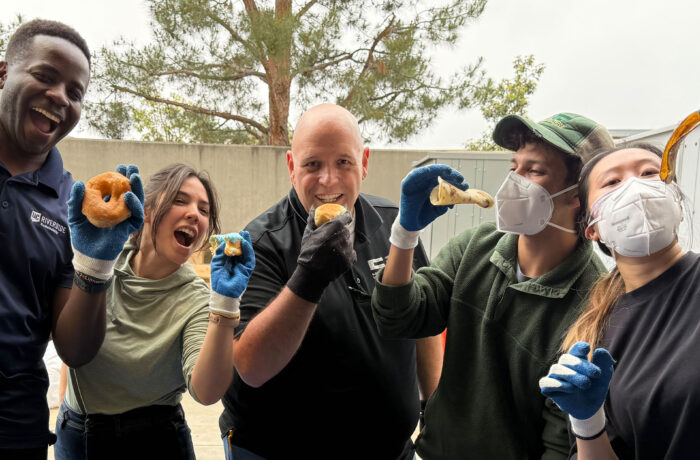

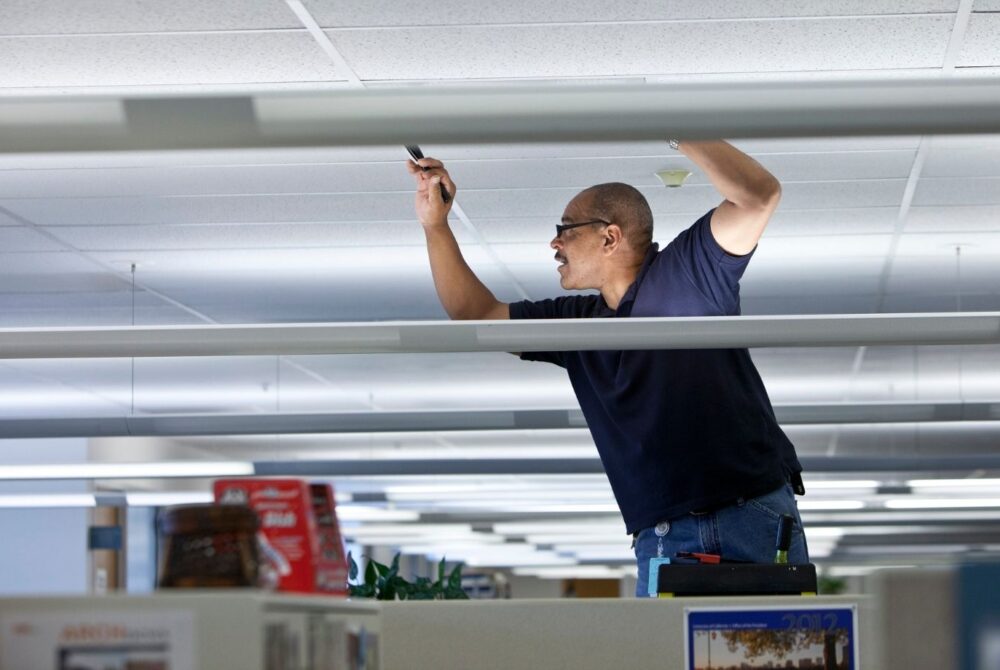
UCOP Conducts Waste Audits
In March 2025, UCOP conducted an internal waste audit at the Intellicenter/UC Path facility to assess stream composition and improve diversion. The project involved UCOP and UCR facilities and Sustainability staff, custodial staff, students and waste hauler partners. The audit revealed operational gaps in bin lining and dumpster access, as well as lack of on-site separation by employees. UCOP is actively addressing these gaps to achieve stronger waste diversion and advance its sustainability goals.
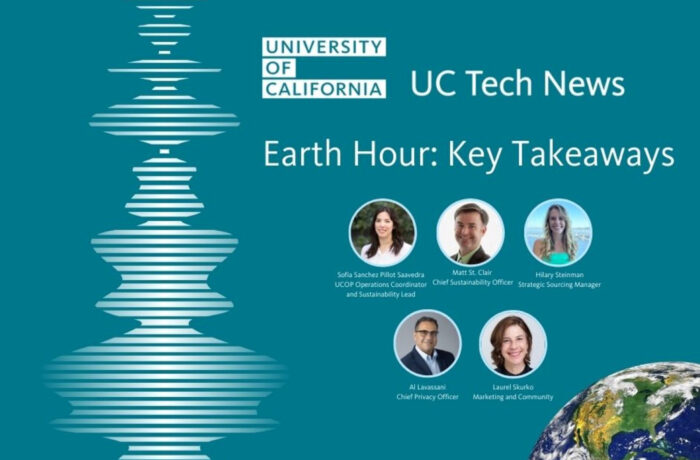
UC Tech Community Champions Sustainability and Energy Innovation
The UC Tech News Team brought together UCOP leaders to discuss the intersection between sustainability and technology at Earth Hour. UCOP Chief Sustainability Officer Matt St. Clair traced two decades of progress, and Hilary Steinman, strategic sourcing manager, spotlighted the 2021 Sustainable Procurement Guidelines and scope 3 reductions. The UCOP team offered both strategic and practical suggestions for tech professionals who want to contribute to UC’s sustainability mission.
EMISSIONS
*Methodological changes in scope 3 accounting introduced beginning in 2019
**90% direct reduction of total emissions from 2019 levels with residual emissions negated by carbon removal
UCOP’s scope 1 emissions remained steady compared to 2023. Scope 2 emissions decreased with UC Center Sacramento’s enrollment in a green tariff electricity program. Scope 3 emissions rose by nearly 39%, likely as a result of more accurate commuter data due to methodological changes, in addition to post-COVID adjustments still happening. Despite this adjustment, UCOP continues to demonstrate an overall downward trend in emissions since 2018, reflecting sustained progress toward reduction goals.
ENERGY – RENEWABLE ENERGY USE
ENERGY USE INTENSITY (EUI)
The modest increase in 2024 EUI was primarily driven by two factors: an increased number of employees working across all UCOP facilities and a steady increase of students staying in UCDC residential units.
Green building
The number of green buildings remained unchanged from last year.
1 Platinum, 4 Gold and 2 Silver
Total number of LEED certifications
procurement

green spend on electronics (93%)

green spend on indoor office furniture (92%)
green spend on cleaning supplies (72%)

green spend on office supplies (13%)
The University reports on green spend, as defined in the Sustainable Procurement Guidelines, and reached out to suppliers for spend data in four product categories for this year’s report.
Green spend is defined as meeting preferred or minimum criteria in UC’s Sustainable Procurement Guidelines.
Suppliers reporting: Electronics (7), Furniture (4), Cleaning supplies (4), Office supplies (3).
UC Systemwide Spend Analytics category data provided by CalUSource.
Transportation
In March 2025, UCOP conducted its first commuter survey since 2018, providing the most accurate picture of post-pandemic commute behaviors. Comparing fiscal year 2023–24 estimates with fiscal year 2024–25 survey results, single-occupancy-vehicle trips rose by under 3%, while telecommuting decreased by 12%. This is likely due to the gradual shift away from the elevated levels of telecommuting seen during COVID. Meanwhile, modest increases in transit, multi-occupancy vehicles, biking and walking (about 5% combined) suggest sustainable commute options remain relatively stable among UCOP employees.
of employees are utilizing sustainable commuting methods
EV charging ports
*Sustainable vehicles are defined as electric (zero-emission), plug-in hybrid or clean transportation fuel.
WATER
*Based on a 3-year average of fiscal years 2005-08
**2025 goal is a 36% reduction from baseline.
UCOP’s water use in 2024–25 shows mixed results against the 2025 goal of 9,414 gallons per person. Overall water use rose 2%, while the number of full-time equivalent staff on-site fell 4%, resulting in a 6% increase to 12,502 gallons per person. Despite efficiencies in some sites, overall UCOP water intensity remains above the 2025 target.
ZERO WASTE – GENERATION
*These numbers might include a small amount of incineration that is being phased out.
**Boundary changes give cause to difference in values from previous years (i.e. leased buildings).
In 2024–25, total waste tonnage decreased by 5%, with per capita daily generation down 2%. While progress continues toward UCOP’s long-term goals, this year marked an important step in refining data accuracy. Waste audits conducted at two facilities provided a clearer picture of actual waste generation compared to prior billing-based estimates, laying the groundwork for more reliable reporting and targeted strategies in the future.
ZERO WASTE – DIVERsion
*Waste incineration was counted as diversion prior to July 2022.
In fiscal year 2024–25, waste diversion decreased by 1 percentage point from 2023–24. Two waste audits clarified on-the-ground issues, including contamination and missed capture, and informed targeted fixes. Midyear changes, such as promoting more paper towel composting, are expected to improve results in the next cycle. UCOP will monitor these interventions through 2025–26 to verify increased organics diversion and reduced landfill disposal.
Single-Use Plastics Phase-Out
Complete Phase-out*
- Plastic bags
Partial Phase-out
- Foodware (UC dining facilities)
- Foodware (third-party dining facilities)
- Beverage bottles (UC dining facilities)
Starting Soon
- Beverage bottles (vending machines)
*Complete phase-out of single-use plastics may include exemptions where reasonable alternatives to plastic do not exist.
Third-party dining and catering are partially compliant due to limited cost-effective compostable alternatives, particularly for hot beverage cups and utensils. Some municipalities prohibit bioplastics, and some waste haulers do not accept compostables requiring more than 15 days to decompose, constraining options. Reusable foodware adoption is underway but gradual.