
Climate
EMISSIONS
*Methodological changes in scope 3 accounting introduced beginning in 2019
**90% direct reduction of total emissions from 2019 levels with residual emissions negated by carbon removal
Systemwide GHG emissions are based on campuses’ and academic health centers’ reported emissions, which will be verified by a third party by early 2026.
Read More About UC’s Progress on Climate
Scope 1, 2, and 3 greenhouse gas (GHG) emissions rose by approximately 3% compared to the previous year, but they still stand at about 8% below the pre-pandemic (2019) levels. Scope 1 emissions experienced a slight increase of 2%, while scope 3 emissions saw a slight decrease of 2%. In contrast, scope 2 emissions showed a notable 18% rise due to changes in local electrical grid emission factors and increased electricity purchases while UC’s largest cogeneration plant was offline for engine replacements. Despite this fluctuation, locations remain committed to achieving UC’s 100% clean electricity goal, which will be reported next year. Additionally, this marked the first year that each location was required to submit scope 3 data for solid waste and business travel, including adding that scope 3 data to each year’s reported emissions back to the 2019 baseline year.
After all locations completed energy system decarbonization studies in fall 2024, the systemwide Pathways to a Fossil-Free UC Task Force compiled the results of these studies in its final report, “Evaluating decarbonization strategies across the University of California.” Locations are navigating changes in federal and state funding and location-specific financial constraints, making it essential to follow the task force’s recommendation to implement decarbonization pathways in phases.
In December 2024, UC locations adopted local targets for reducing GHG emissions by 90% by 2045, along with interim targets for scope 1 reductions that outline a path to meeting the 2045 goal. To support these targets, locations are drafting updated climate action plans to identify more specific actions to implement in pursuit of their scope 1, 2 and 3 climate commitments. The updated climate action plans will be submitted in June 2026 and will consider GHG emission reductions across all three scopes of emissions, as well as equity impacts and climate resilience as a continuation of each location’s recent work in these areas.

Scope 1
Direct emissions (e.g., burning gas and oil)

Scope 2
Indirect emissions from purchased power

Scope 3
Commuting, business travel, waste, etc.
UC’s tracked greenhouse gas emissions
Diversity, Equity, Inclusion and Justice

The University made progress in assessing how efforts to implement sustainable practices can avoid harm and benefit all University community members. Climate protection remained a significant focus, with findings and recommendations in the “Evaluating decarbonization strategies across the University of California” report exploring how to ensure that the transition to fossil-free campus energy infrastructure includes plans for helping campus operational staff gain the skills needed to operate new energy systems and equipment. Campuses and academic health centers have integrated the decarbonization report’s recommendations into their updated climate action plans.
Read More About UC’s Progress on Diversity, Equity, Inclusion and Justice
Beyond decarbonization and climate action planning, systemwide working groups responsible for individual sustainability policy sections incorporated equity considerations into proposed policy updates for sustainable transportation and sustainable water systems, as well as grant funding processes for green laboratory operations and single-use plastics reduction. For example, the Sustainable Operations and Laboratories Working Group held collaborative discussions with working group representatives from each campus to understand each campus’s unique needs and priorities. This inclusive approach ensured that all campuses could utilize grant funding effectively. As another example, the Sustainable Transportation Working Group developed updated policy language and the “Electric vehicle ramp-up guide,” which includes strategies for reducing disparities in fleet electrification and charging infrastructure.
Energy
To continue to reduce its carbon footprint, the University is efficiently using its resources and changing the sources of energy that campuses and academic medical centers consume.
Read More about uc’s progress on energy
Energy Efficiency
Energy efficiency and green building practices have reduced UC’s energy use intensity across its portfolio of buildings.

Cost savings in 2024

Cumulative cost savings since 2010
ENERGY USE INTENSITY (EUI)
As a metric for relative efficiency, energy use intensity (EUI) is calculated by totaling all of the energy used by a location and dividing the sum by the associated square footage. In 2024, UC locations continued their energy efficiency efforts while working to retain the energy use reductions realized in previous years, now with increased on-campus activity and the significant expansion of UC Health facilities. As a result, the system was still able to achieve just under a 2% annual reduction in EUI but needs to drive additional efficiency increases over the next two performance years to meet UC’s cumulative goal.
Renewable Energy and the UC Clean Power Program
ENERGY – RENEWABLE ENERGY USE
The University of California ranks first among colleges and universities when it comes to green electricity use, according to the U.S. Environmental Protection Agency. In addition to over 55 megawatts of on-campus projects, the University has three operating utility-scale solar projects in California under contract: Five Points (60 megawatts), Giffen Solar Park (20 megawatts) and Golden Fields (30 megawatts with a 15 megawatt battery).
The University of California signed its first-ever wind energy contract in 2023, the largest renewable energy commitment by the University to date in support of campus decarbonization. The contract with SunZia Wind provides electricity from a 3,500-megawatt wind project in New Mexico delivered to California along a 550-mile transmission line. The expected electricity generation from UC’s 85-megawatt portion of SunZia is equivalent to the total annual electricity consumption of UC Santa Cruz, UC Santa Barbara, UC Riverside and UC Merced combined.
Renewable energy from the wind project will be used by every UC campus and academic medical center. UC Clean Power — an electric service provider operating through California’s Direct Access Program — will use a significant portion to continue serving campuses with clean electricity. The project will be a key resource for UC Clean Power to continue meeting the state’s Renewables Portfolio Standard and statewide energy sector greenhouse gas reduction targets. UC Clean Power has provided 100% clean electricity to UC locations since 2018 and supplies approximately 48% of the University’s purchased electricity.
Food Service
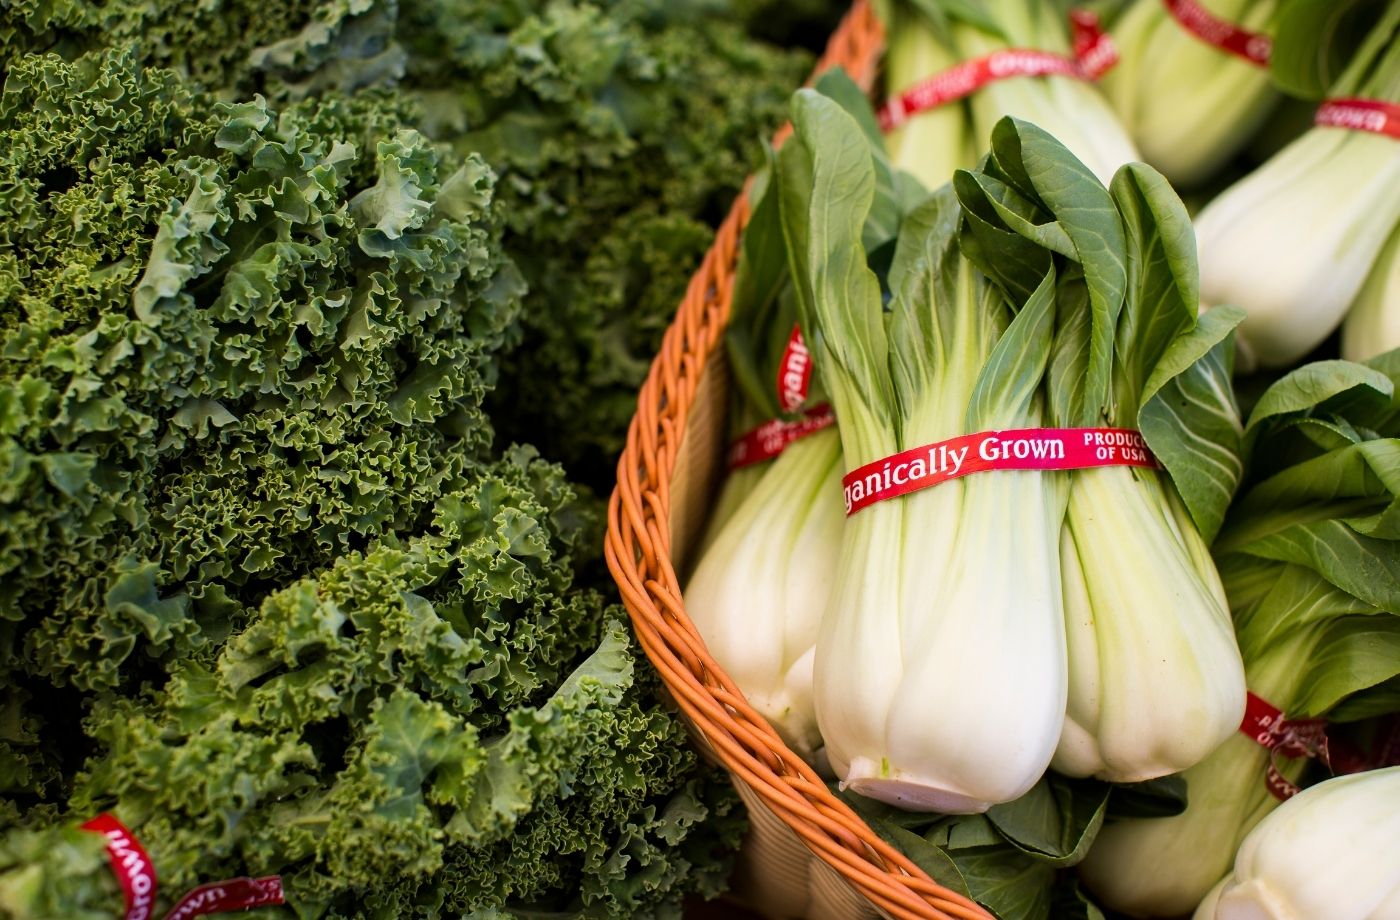
of food and beverage purchases met sustainability criteria ($24M)
of food and beverage purchases were plant-based ($50.3M)
Campuses have a goal to procure 25% sustainable food products, as defined by AASHE STARS, by 2030.

of food and beverage purchases met sustainability criteria ($11.3M)
of food and beverage purchases were plant-based ($13.6M)
UC Health has a goal to procure 30% sustainable food products, as defined by Practice Greenhealth, by 2030.
Read More About UC’s progress on Food Service
This year, the UC Global Climate Leadership Council continued to fund technical assistance to advance sustainable food supply chain sourcing and dining practices, as well as a Bonnie Reiss Sustainable Food Services Fellowship to support UC Dining Services with sustainable food sourcing and data collection. Project outcomes included connecting campuses with local and sustainable producers and food hubs, holding an event with campus chefs to streamline meat product purchasing across the system to reduce cost and increase sustainable spend, modifying language in requests for proposals to prioritize sustainable food options and developing a toolkit for fellows supporting Dining Services.
Concurrently, UC campuses continued to face significant challenges, including food cost inflation and budget cuts, as well as continuing difficulties with data tracking and reporting. As a result, nine locations were able to increase their sustainable food spend, while others saw reductions. Sustainable food spend represented 16% of food purchases on campuses and 23% of purchases at health centers in fiscal year 2024–25. This amounts to over $35 million going to sustainable food suppliers.
Of the University’s total food and beverage spend, 31%, or over $63 million, was on plant-based food items. Ten locations are already on track to meet the policy goal of at least 25% spend on plant-based food by 2030.
The Sustainable Food Services Working Group is using lessons learned from engagement across the system and reviewing updated standards from the Association for the Advancement of Sustainability in Higher Education (AASHE) and Practice Greenhealth to develop updated systemwide food policy goals.
General Sustainability Performance Assessment
Read More about UC’s General Sustainability Performance Assessment
All nine undergraduate UC campuses participate in the Association for the Advancement of Sustainability in Higher Education’s Sustainability Tracking, Assessment and Rating System (AASHE STARS).
Six of the nine undergraduate campuses currently hold an AASHE STARS Gold rating. UC Berkeley and UC San Diego have a Platinum rating, the highest STARS rating. Three UC campuses, UC Berkeley, UC Riverside, and UC Santa Cruz earned ratings in the latest version of STARS, version 3.0. UC Merced previously received a Platinum rating and is planning to submit for an updated rating in 2026.
STARS is the leading North American sustainable campus rating system and was developed by colleges and universities, including UC. The AASHE STARS Steering Committee guides the STARS development and implementation process and currently includes representation from the University’s sustainability officers. STARS is a transparent, self-reporting framework for colleges and universities to measure their sustainability performance. STARS provides the foundation for other campus sustainability rankings and is a primary standard by which peer institutions evaluate their overall achievements and progress in sustainability.
UC campuses, academic health centers and Lawrence Berkeley National Laboratory received many additional awards in fiscal year 2024–25.
Green Building
LEED Certifications
*Data reported only accounts for buildings certified through the first half of 2025.
Read More about uc’s progress on green building
In the past fiscal year, UC locations reported 14 new LEED-certified green building projects: three Platinum, nine Gold, and two Silver certifications. UC’s total LEED certifications now include 467 projects, representing approximately 41 million square feet. The past year saw an increase in the University’s all-electric building portfolio, which now comprises 45 buildings, exceeding 4.5 million square feet of occupied space. An additional six facilities (1 million square feet) use only electricity for space and water heating. UC campuses continue to add to this total, with another 50 all-electric buildings in planning, design and construction phases, totaling almost 11 million square feet. UC locations are pursuing Parksmart certification for nine new parking projects, adding to the University’s five existing certified facilities.
The Green Building Working Group has proposed an update to the Sustainable Practices Policy that would require monitoring-based commissioning (MBCx) throughout the first year of a new building project’s occupancy. This is an opportunity to ensure that building systems perform as designed while taking advantage of the contractor’s warranty period to make no-cost corrections. By making a small investment in MBCx, the University will reduce energy use, capture cost savings, ensure equipment longevity and optimize thermal comfort for occupants.
Health and Well-Being
healthy vending spend on food ($525K)
healthy vending spend on beverages ($916K)
Healthy vending is defined as meeting UC’s Healthy Vending Guidelines. Data is from 2023–24.
Read More about uc’s progress on health and well-being
The University made significant progress toward its goals for healthy vending and chemicals of concern in the past year. Nine campuses and five health locations reported fiscal year 2023–24 data on food and beverage vending machine spend. This is the first year that the UC Annual Sustainability Report includes this data, which shows that, on average, healthy food accounted for 23% of all food sold from vending machines, and healthy beverages accounted for 34% of the beverages sold.
The Sustainability and Well-Being Working Group also explored ways to reduce chemicals of concern on campus. The working group developed informational materials to augment the furniture section of the UC Sustainable Procurement Guidelines, clarifying the policy goals for buyers and vendors. The working group also assessed implementation challenges, meeting with key stakeholders to explore how to make the guidelines clearer, and provided recommendations to improve the guidelines. As a result of this effort, data collection for the furniture green spend was updated to better represent UC’s goals to purchase furniture free of chemicals of concern.
Procurement

green spend on electronics (62%)

green spend on indoor office furniture (84%)

green spend on cleaning supplies (53%)

green spend on office supplies (20%)
Green spend is defined as meeting preferred or minimum criteria in UC’s Sustainable Procurement Guidelines.
Suppliers reporting: Electronics (12), Furniture (8), Cleaning supplies (7), Office supplies (5).
UC Systemwide Spend Analytics category data provided by CalUSource.
green spend on appliances and IT hardware (98%)
green spend on office supplies (23%)

cost savings through medical device reprocessing, representing 247,000 pounds of medical waste avoided
Green spend is defined as meeting preferred or minimum criteria in UC’s Sustainable Procurement Guidelines.
Suppliers reporting: Appliances and IT hardware (8), Office supplies (1).
“Reprocessing” refers to the FDA-approved re-manufacturing process carried out on a used device, including cleaning, disinfection, sterilization, testing and related procedures to allow its safe reuse. This process allows health facilities to reduce their reliance on single-use devices.
Read More About UC’s Progress on Procurement
This year, the Sustainable Procurement Working Group began a process of updating the Sustainable Procurement Guidelines to address implementation challenges and changing regulations. Updates will include the replacement of the Economically and Socially Responsible Spend section with the Economic and Community Impact Spend section to better support UC’s local economy and communities, changes to the foodware section to address composting challenges and updates to the furniture section to facilitate implementation.
The University also continued to improve its process of collecting sustainable campus procurement data. The UC Procurement Analytics team analyzed data for over $138 million in total campus spend from 32 suppliers for the 2024–25 fiscal year; this represents a 51% increase in the amount of spend analyzed from the prior year. Within that spend, the University found that 62% of electronics, 84% of indoor office furniture, 53% of cleaning supplies and 20% of office supplies met UC’s requirements on minimum or preferred green spend, as outlined in the Sustainable Procurement Guidelines. This represents nearly $88 million in spend on products meeting green certification standards. UC Health locations also reported their green spend on office supplies and electronics and contributed an additional $21 million in spend on products meeting green certification standards. Analysis of UC’s support of small businesses, presented to the state each year, can be found online.
Trademarks and Licensing
The UC Code of Conduct for Trademark Licensees Steering Committee met throughout the 2024–25 academic year to collectively assess trademark licensees’ progress in meeting the contractually binding UC Trademark Licensing Code of Conduct sustainability standards.
The committee discussed current and emerging developments affecting UC campuses’ trademark licensees’ adherence to the code, including:
- U.S. Customs and Border Protection’s enforcement of recent federal tariffs on products of all kinds and the impact that these tariffs are having on UC campus licensees and their supply chains’ treatment of workers.
- Identification of UC licensees that source their products from production facilities in Pakistan and are required to sign the Pakistan Accord for health and safety in the textiles and garment industry, a legally binding agreement to achieve safe factories with the agreement of apparel businesses, international unions, worker advocacy organizations and the International Labor Organization. Signatories include a growing list of licensee and international apparel brands, encompassing more than 90% of licensees that have disclosed manufacturing sources in Pakistan for UC campuses’ products.
- Individual licensees’ manufacturing partners’ remediation of workplace rights and conditions violations.
- The implications of SB 707 California Responsible Textile Recovery Act on apparel licensee businesses.
Overall, the global impact of the University of California’s licensed product manufacturing extends to 48 countries where more than 4,400 disclosed suppliers manufacture for 369 licensee companies that are licensed to use UC campus trademarks on products that are sold to the public.
Sustainable Building Operations and Laboratories
total assessed green laboratories
Read More about UC’s Progress on Sustainable Building operations and laboratories
By the end of fiscal year 2024–25, the cumulative number of laboratories certified as green by campuses totaled 253. This 37% decrease in certified green labs from the prior year reflects some previously certified laboratories not maintaining their certification as staffing shortages resulted in some campuses pausing green lab certification programs, as well as significant redesign of several programs. However, ongoing green lab programs across the University reported engagement with 1,221 individual researchers throughout the year.
The Sustainable Operations and Laboratories Working Group supported these efforts by engaging with all campuses to develop a plan to allocate sustainability funds received through a new systemwide contract with Carl Zeiss Microscopy. This partnership will strengthen campus green lab programs by funding student positions, expanding rebate opportunities, enhancing services and initiatives to advance sustainable lab operations, and/or supporting engagement activities. The first round of Zeiss funds is scheduled for distribution in fiscal year 2025–26.
This year also was the third year of the rebate program for energy- and water-efficient equipment funded through a partnership with Fisher Scientific. In 2024–25 this program enabled 23 pieces of energy- and/or water-inefficient equipment to be replaced across the system, bringing the total to 63 pieces of equipment across the life of the incentive program.
Transportation
of students and employees are utilizing sustainable commuting methods
of all vehicles and 70% of sedans and minivans acquired in 2025 were sustainable vehicles*
33%
of the fleet consists of sustainable vehicles*
EV charging ports
*Sustainable vehicles are defined as electric (zero-emission), plug-in hybrid or clean transportation fuel
Read More about uc’s progress on transportation
In 2024–25, the overall (student and employee) single-occupancy-vehicle (SOV) rate for the University of California was approximately 25%. This means over 75% of students, faculty and staff utilized a sustainable commute option, such as telecommuting or commuting to campus by walking, biking, taking transit, or in a vanpool or carpool. However, despite this progress, only seven of the 13 locations that reported data are on track to meet the goal of reducing SOV commute rates by 10%.
The focus of the UC Global Climate Leadership Council (GCLC) this academic year is on transportation emissions, with deep dives planned into fleet, commuting and business travel. The GCLC plans to propose new policies, programs and best practices for reducing transportation emissions. In parallel, the systemwide Sustainable Transportation Working Group developed recommendations to update sustainable transportation goals in alignment with the University’s long-term climate goals. The proposed policy updates are currently under review and will be published in spring 2026.
Systemwide, 51% of all new fleet vehicles (light, medium and heavy-duty) acquired in fiscal year 2024–25 were battery-electric, plug-in hybrid, or another qualifying clean transportation fuel vehicle, up 2% from the previous year. UC’s goal is that alternatively powered vehicles account for at least 50% of all vehicle acquisitions at each campus (regardless of vehicle size). Systemwide, 70% of all sedans and minivans acquired meet the UC policy, falling short of the ambitious goal of 100%.
UC locations now host over 2,400 active electric vehicle (EV) charging ports, an increase of approximately 10% from last year, along with many additional EV-ready spaces to support fleet and commuter vehicles.
UC Health
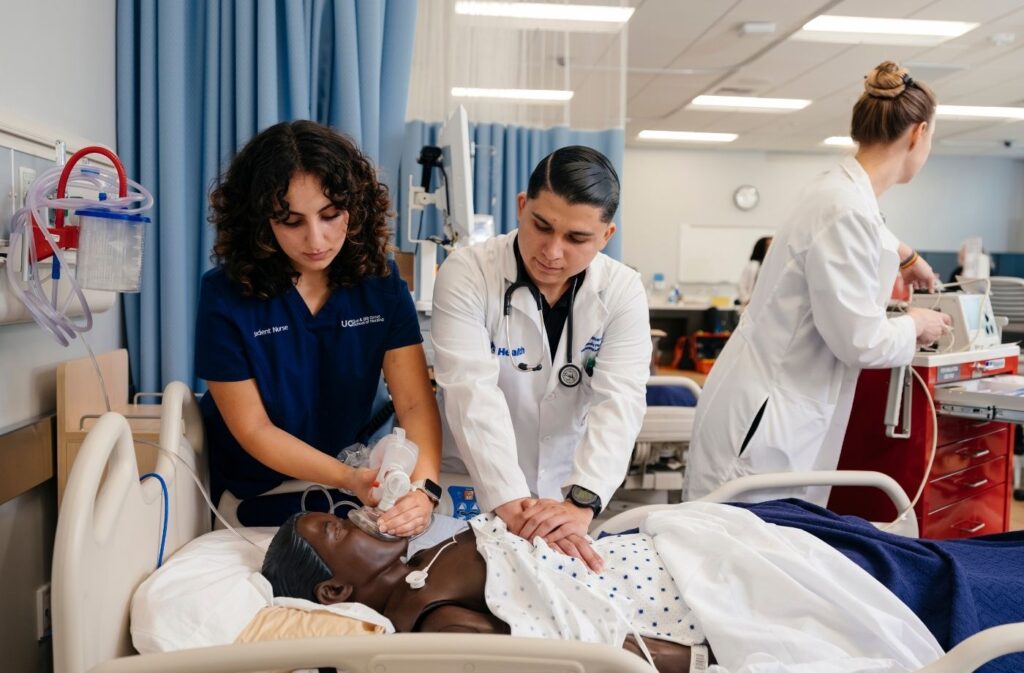
As part of continued operational and capacity expansion, UC Health locations included innovative design features to reduce energy use and greenhouse gas emissions in both new and existing health care facilities.
Read More about UC’s progress on health
UC Health also continued its efforts to address scope 3 greenhouse gas emissions from sources like transportation and supply chain. UC Health published an inventory of its scope 3 emissions showing that the largest sources of emissions are from the supply chain. Based on that analysis, UC Health initiated a project to reduce the greenhouse gas emissions from the largest sources of emissions within its supply chain.
UC Health locations also evaluated the impact of climate change and the environment on the communities they serve. Locations developed and included a climate-related question in their Community Health Needs Assessments. UC San Diego Health also conducted a survey to determine the importance of environmental values and sustainable practices to their patients. The survey results showed that 85% of UC San Diego Health patients prefer to receive health care from an organization that is committed to environmental health and sustainability.
The University of California’s Center for Climate, Health and Equity (CCHE) continued to elevate clinical decarbonization as a health care priority. CCHE facilitated the second year of its new Clinical Decarbonization Fellowship, selecting three UC clinician fellows to work on decarbonization projects in UC clinical health care settings. CCHE also facilitated six educational webinars and one clinician training session in response to the 2025 LA area wildfires. Further, CCHE partnered with the American Medical Association to provide continuing medical education on climate change and health in collaboration with UC’s Bending the Curve climate education initiative.
Water
WATER USE
*Based on a 3-year average of fiscal years 2005–08.
**2025 goal is a 36% reduction from baseline.
Systemwide calculations exclude ANR, UCDH, UCIH, and UCSFH.
Read More about uc’s progress on water reduction
Total water consumption systemwide increased slightly in 2024–25 compared with the previous year. Ten out of 15 locations are on track to meet the growth-adjusted water conservation goal of reducing potable water consumption by 36% by the end of 2025–26. Locations that are not yet on track to meet the goal cited a range of technical challenges, including increases in square footage growth that do not correlate with population growth, aggressive water conservation programs prior to the baseline period, limited recycled water supplies to offset potable water use and limited funding.
The University continued to advance water conservation by advancing UC policy for equitable access to safe drinking water and sharing resources and funding opportunities related to water recycling.
Zero Waste
ZERO WASTE – DIVERsion
*Waste incineration was counted as diversion prior to July 2022.
single-use plastics phase-out
*17 locations included: campuses, academic health centers, LBNL and UCOP.
**Complete phase-out of single-use plastics may include exemptions where reasonable alternatives to plastic do not exist.
Read More about UC’s progress on zero waste
The University continued focusing on the phase-out of single-use plastics. The number of locations that have completely phased out plastic bags rose from 12 the prior year to 15. As campuses continued to struggle with fully phasing out single-use plastic foodware and beverage bottles, the UC Global Climate Leadership Council selected 13 projects across the UC system to pilot reusable or compostable alternatives to single-use plastic foodware. Projects include supporting awareness campaigns, piloting reusable dishes and to-go ware, and installing hydration stations.
Five campuses are on track to meet the 2025 goal of reducing per capita municipal solid waste generation by 25 percent from the 2015–16 baseline year. Two of those campuses are also already on track to meet the 2030 goal of a 50% reduction. Among the five campuses not yet on track to meet the 2025 goal, two of them are within 2 percentage points of the goal. Campuses continue to seek waste reduction opportunities to work toward the 2030 goal of 50% reduction from the 2015–16 year.
UC Health locations have made significant strides toward their 2025 goal of 25 pounds or less of waste per adjusted patient day. Two UC Health locations are on track to meet the 2025 goal, and the remaining three had significant reductions, bringing them closer to meeting the goal.
Campuses also continue working toward achieving the goal of diverting 90% of waste from the landfill. The University is actively seeking diversion opportunities and innovative ways to approach waste management for both campus and health locations.