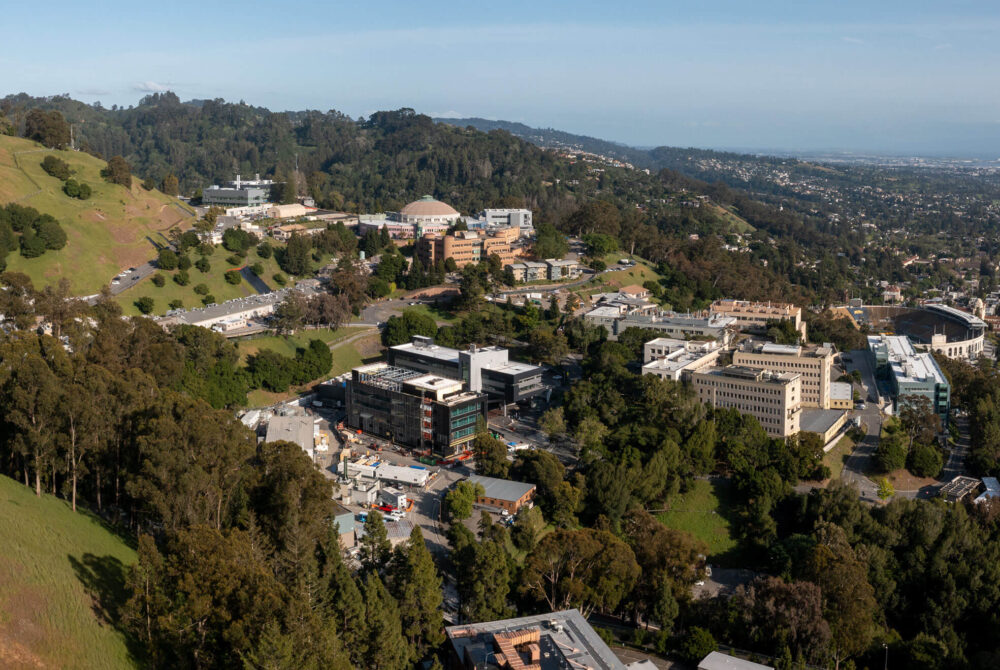
Lawrence Berkeley National Laboratory (Berkeley Lab) is a Department of Energy Office of Science research laboratory operated by the University of California. Sustainability performance highlights from the past year include:
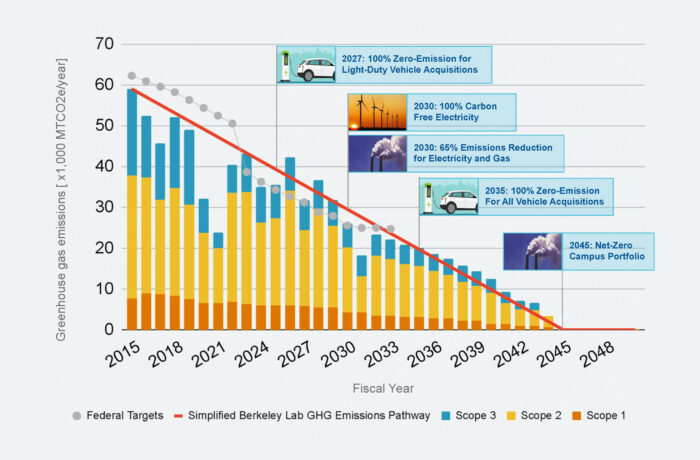
Net-zero planning: In May 2023, the Lab released a net-zero vision and roadmap to define a decarbonization pathway across all reported greenhouse gas emissions by no later than 2045.
Read More about sustainability at berkeley lab
Energy savings: The Lab maintains a portfolio of energy and water savings that currently generates an annual utility bill savings of over $1.3 million, driven primarily by a dedicated ongoing commissioning team. As of the end of March 2023, the Lab’s total weather-corrected energy consumption per square foot in its general building stock is 28% lower than in 2015. Fossil gas consumption across the Lab is down 28%.
Greenhouse gas (GHG) emissions: Total reported GHG emissions as of October 2022 are 31% below 2015 levels.
ISO 50001: The Lab completed a third-party three-year re-certification audit of its energy and water management system against ISO 50001, an international energy management standard.
Circular economy: The Lab conducted a pilot project with a local vendor to divert laboratory plastics and use them to manufacture new laboratory plastic ware. These items are not currently accepted by the Lab’s waste-hauling contractor for recycling. As of fall 2023, the Lab has circularized approximately 2,000 pounds of plastics into new laboratory consumables.
Energy consumption is up slightly compared to the previous year as on-site populations increase, but lower than pre-pandemic levels.
Stories
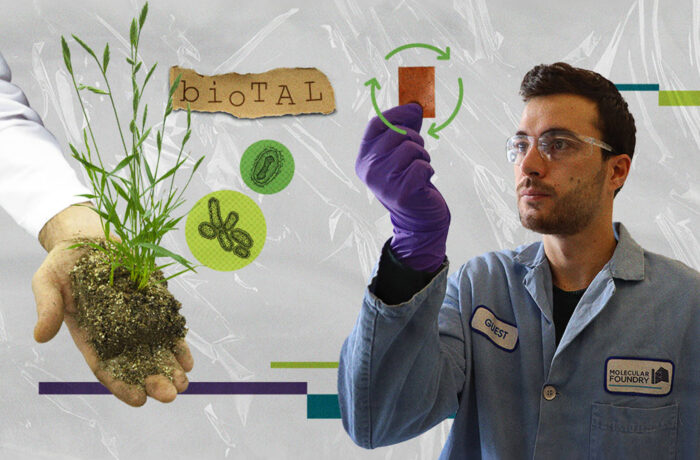

Making Renewable, Infinitely Recyclable Plastics Using Bacteria
Scientists at Berkeley Lab engineered microbes to make the ingredients for recyclable plastics, replacing finite, polluting petrochemicals with sustainable alternatives. The new approach shows that renewable, recyclable plastics are not only possible but also outperform those from petrochemicals.
Berkeley Lab’s Vision and Roadmap for a Net-Zero Campus
Berkeley Lab has created a vision and roadmap to achieve net-zero greenhouse gas (GHG) emissions across its campus by no later than 2045. Released in May 2023, the document identifies seventeen actions to reduce GHG emissions by at least 90% and negate remaining emissions through carbon removal, consistent with the new UC climate action policy.
CLIMATE PROTECTION – EMISSIONS
* Interim goals for 2030, 2035 and 2040 to be developed through fossil-free planning that is underway at each location
** 90% direct reduction of total emissions from 2019 levels with residual emissions negated by carbon removal
Berkeley Lab greenhouse gas emissions for federal fiscal year 2022 (the 12 months through September 2022) were 31% lower than in fiscal year 2015. Some reductions are attributable to significant improvements in energy efficiency. The energy consumption per square foot of the Lab’s general building stock is 28% below 2015 levels. Natural gas efficiency improvements are deeper: the Lab’s sitewide natural gas consumption per square foot is 35% below 2015 levels. Scope 3 emissions remain at about one-third pre-pandemic levels.
ENERGY USE INTENSITY (EUI)
Berkeley Lab saw a decrease in its EUI in 2022.
Green building
A new 74,000-square-foot laboratory building, called BioEPIC, is under construction and targeting LEED Gold certification. BioEPIC will use only electricity for space and water heating. A new 47,000-square-foot cafeteria and conference center is just beginning construction. It is also targeting LEED Gold and will be all-electric, including the cafeteria kitchen.
1 Platinum and 6 Gold
Total number of LEED certifications
Transportation
EV charging ports
of all vehicles acquired in 2023 were electric (zero-emission), plug-in hybrid or clean transportation fuel
Berkeley Lab has approximately 1,960 employee and fleet parking spaces on the main site, including 29 active employee electric vehicle charging locations. In UC fiscal year 2022–23, utilization of EV charging surpassed pre-pandemic levels and continues to grow. The Lab’s employee EV charging program had a membership of about 300 people as of June 2023, a significant increase from the previous year. During the reporting period, 45% of all light-duty fleet vehicle acquisitions were fully electric.
WATER
*Based on fiscal year 2007-08
**2025 goal is a 36% reduction from baseline
Berkeley Lab recently installed three new water meters to directly measure the water consumption at its main site. This replaces the previous method, which utilized East Bay Municipal Utility District meters and an aggregation of submeters owned by UC Berkeley to calculate sitewide consumption. This change has improved the accuracy of metering and indicates that water consumption at Berkeley Lab’s main site is approximately 25% lower than historically reported. Water consumption per square foot, based on the three new meters, is 22.5 gallons per square foot-year for the 2022–23 UC fiscal year.
ZERO WASTE – GENERATION
*These numbers might include a small amount of incineration that is being phased out.
**In 2021, waste generation per weighted campus user spiked due to pandemic-related closures as base-level operations continued but the number of users on campus decreased.
Berkeley Lab’s waste generation per person for UC fiscal year 2022–23 remains similar to last year at 0.4 pounds per person-day. Waste generation per person is on a downward trend since UC fiscal year 2018–19. In total for UC fiscal year 2022–23, the Lab generated 579 tons of waste and diverted 363 tons of waste from building operations (excluding construction and demolition). Construction waste increased compared with last year due to construction of the new BioEPIC building and demolition of the cafeteria building. Due to the shutdown of the Lab’s cafeteria services, overall included organic waste generation decreased.
ZERO WASTE – DIVERsion
*Waste incineration was counted as diversion prior to July 2022.
Berkeley Lab had a diversion rate of 63% excluding construction and demolition and a rate of 75% including construction and demolition. One large source of diverted material is scrap metal, the generation of which decreased by 28% compared with last year. Due to the shutdown of the Lab’s cafeteria services, diverted organic waste has decreased, leading to reduction in the overall diversion rate (excluding construction and demolition).
Awards
The Lab received Honorable Mention in the 2022 U.S. Department of Energy Sustainability Awards for its Sustainability Data Integration, Organization, Processing, Analytics, and Visualization Project.
A full list of awards is featured on the UC Office of the President’s website.