UC Berkeley continues to make significant progress toward its sustainability goals and proudly earned the No. 1 spot in the first Quacquarelli Symonds World University Sustainability Rankings.
Berkeley’s recognition as a global leader in sustainability was comprehensive, including its sustainable operations, education and research. Notably, the groundbreaking Clean Energy Campus initiative, slated to reduce building carbon emissions by 85%, achieved significant milestones this year, including the conceptual design of the new electrified heating and cooling central plant and on-site renewable energy and storage.
READ MORE ABOUT SUSTAINABILITY AT UC BERKELEY
The Student Environmental Resource Center celebrated a decade of impactful activism and community engagement, further propelling the campus vision for a more environmentally just world. Additionally, the Office of Sustainability launched the UC Berkeley Business Air Travel Carbon Mitigation Program, which will invest in campus carbon reduction projects and increase climate action awareness.
With on-site operations resuming following closures, emissions understandably increased. UC Berkeley, though, remains ahead of the curve to reach UC carbon emissions goals, with phase one of the Clean Energy Campus initiative slated for completion in 2028. Berkeley continues to progress in meeting its ambitious sustainability goals.
Stories
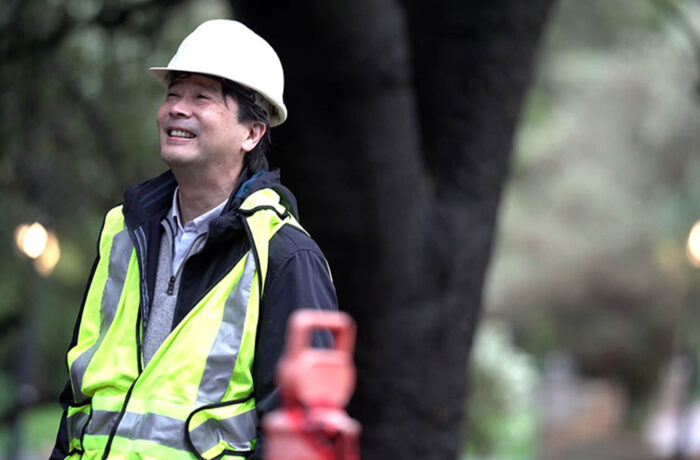

UC Berkeley Drills Borehole To Explore Geothermal Heating on Campus
As part of UC Berkeley’s decarbonization efforts, researchers drilled a 400-foot-deep borehole on UC Berkeley’s campus to explore the viability of using a geothermal heat pump system to help heat and cool its buildings more efficiently.
UC Berkeley To Embark on $700 Million Campuswide Clean Energy Plan
UC Berkeley plans to replace its natural gas-powered cogeneration plant with a clean and resilient energy system through the Berkeley Clean Energy Campus project. The first phase is slated to be complete by 2028.
CLIMATE PROTECTION – EMISSIONS
* Interim goals for 2030, 2035 and 2040 to be developed through fossil-free planning that is underway at each location
** 90% direct reduction of total emissions from 2019 levels with residual emissions negated by carbon removal
Compared to years with pandemic-related closures, the data from 2022 portrays a more typical operational scenario. A new cogeneration turbine is expected to reduce natural gas usage. Purchased electricity came from a cleaner mix in 2022, which led to fewer scope 2 emissions. Employee commute-related emissions declined due to an upswing in carpooling and remote work. However, there was a surge in business air travel following the post-pandemic resumption of conferences and business trips.
ENERGY – RENEWABLE ENERGY USE
ENERGY USE INTENSITY (EUI)
UC Berkeley saw an increase in its EUI in 2022.
FOOD
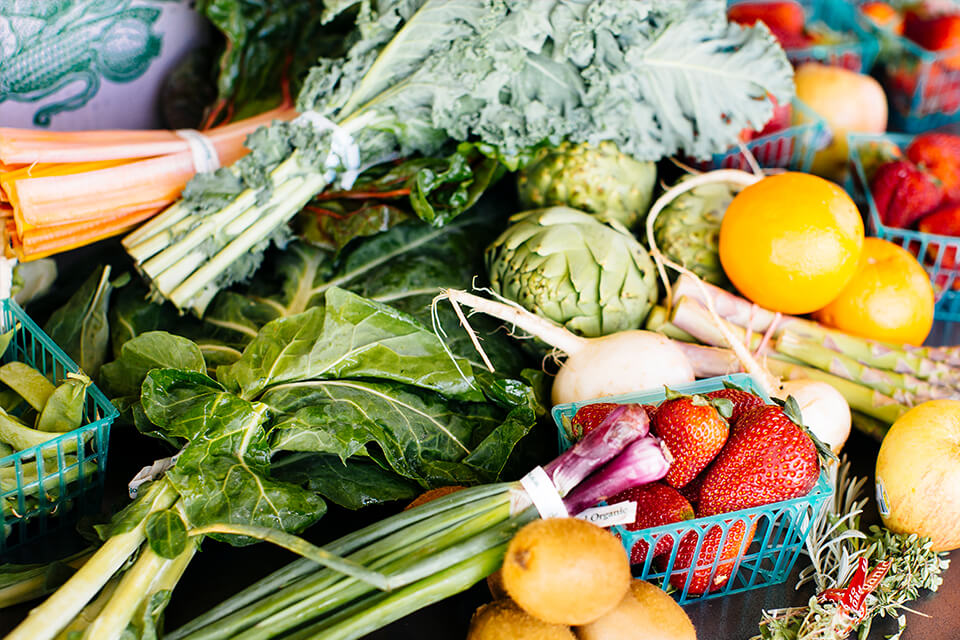
of food and beverage purchases met sustainability criteria ($4.7M)
of food and beverage purchases were plant-based ($4.8M)
The increase in sustainable purchasing can be attributed to Berkeley Dining’s strategic decision to procure additional seafood, aligning with Menus of Change principles and their commitment to sourcing sustainable seafood. Additionally, Berkeley Dining’s dedication to procuring sustainable beef, chicken and local organic produce underscores the ongoing commitment to environmentally conscious dining practices.
Green building
There are nine electric building projects at Berkeley: Three are under construction, four are in design, and two are in the planning phase. The Bakar BioEnginuity Hub, the most recent certified building, received LEED Gold certification in 2022 and is Berkeley’s first occupied all-electric building.
2 Platinum, 15 Gold, 9 Silver and 1 Certified
Total number of LEED certifications
procurement

green spend on electronics (33%)
green spend on cleaning supplies (50%)

green spend on indoor office furniture (98%)

green spend on office supplies (73%)
The University reports on green spend, as defined in the Sustainable Procurement Guidelines, and reached out to suppliers for spend data in four product categories for this year’s report.
Green spend is defined as meeting preferred or minimum criteria in UC’s Sustainable Procurement Guidelines.
Suppliers reporting: Electronics (6), Furniture (4), Cleaning supplies (6), Office supplies (4).
UC Systemwide Spend Analytics category data provided by CalUSource.
Sustainable Building & Laboratory Operations
The Green Labs program, housed under the Office of Environment, Health and Safety at UC Berkeley, continues to operate, certifying more labs this year. The campus upgraded lab equipment, replacing two older autoclaves with newer models.
total assessed green laboratories
Transportation
of students and employees are utilizing alternative commuting methods
EV charging ports
of all vehicles acquired in 2023 were electric (zero-emission), plug-in hybrid or clean transportation fuel
The campus fleet acquired 13 electric vehicles this fiscal year. There was no change in the number of parking and EV charging stations. The campus continues to see heavier use of hybrid and remote schedules with employees following the pandemic. Additionally, there was a higher percentage of zero-emission vehicles in fiscal year 2022–23 compared with past years.
WATER
*Based on a 3-year average of fiscal years 2005-08
**2025 goal is a 36% reduction from baseline
In fiscal year 2022–23, water consumption per capita decreased by nearly 300 gallons. This decline can be attributed to a range of drought response initiatives that were put into action across UC Berkeley’s campus facilities and housing locations. These efforts included improved leak detection and the efficient management of water usage, aided by the successful pilot of smart meters in collaboration with the local water utility.
ZERO WASTE – GENERATION
*These numbers might include a small amount of incineration that is being phased out.
**In 2021, waste generation per weighted campus user spiked due to pandemic-related closures as base-level operations continued but the number of users on campus decreased.
Solid waste at UC Berkeley remained relatively consistent compared to prior years, with a slight increase in landfill and compost generation.
ZERO WASTE – DIVERsion
*Waste incineration was counted as diversion prior to July 2022.
Solid waste diversion decreased compared with last year due to a smaller percentage of reuse projects in the last academic year. Over time the diversion rate has stayed consistent.
Awards
Out of 700 global higher education institutions, UC Berkeley was named the top sustainable university in the Quacquarelli Symonds World University Sustainability Rankings for its focus on tackling environmental, social and governance issues. The campus achieved a perfect score of 100.
A full list of awards is featured on the UC Office of the President’s website.