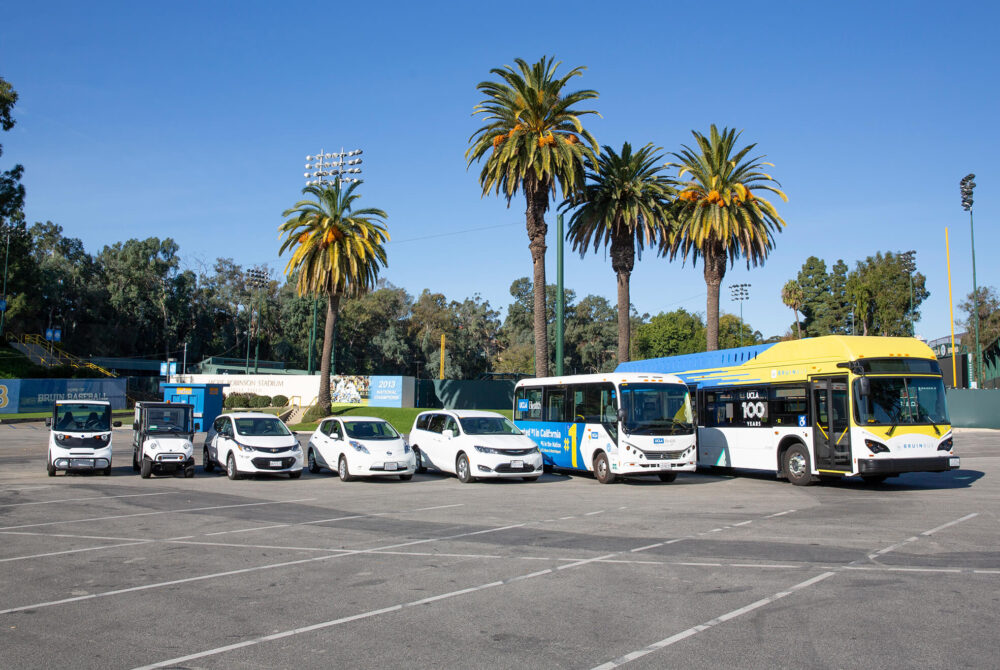
Highlights of progress this year include recognition as having the greenest fleet in a national ranking and a new EV Readiness Plan that targets electric vehicle adoption at UCLA.
Beyond the campus, the UCLA Sustainable LA Grand Challenge launched a new initiative to bring UCLA scholars together with community stakeholders. Called TRACtion —Transformative Research and Collaboration — the program began with a series called Transformative Transportation in Los Angeles. Water conservation and biodiversity efforts continued with the conversion of over 27,000 square feet of turf to native plants. UCLA expanded its dedication to protecting biodiversity through a commitment to the international coalition Nature Positive Universities Alliance.
Read More about Sustainability at UCLA
At the intersection of health and sustainability, UCLA Dining increased sustainable food and beverage spending by 50% and worked with students on a Sustainability Action Research team to improve sustainable food tracking. Bruin Dine, a student-run organization that works to bridge the gap between food waste and food insecurity by recovering food that would have been thrown away, recovered over 4.5 tons of food with support from Sustainability, the Community Programs Office and a grant from CalRecycle.
UCLA’s Green Building program continued to expand. Four new LEED Gold apartment buildings welcomed 2,300 students, additional Gold and Platinum projects are pending, and two all-electric buildings are planned. As Southern California braces for more summer heat waves, the city of Los Angeles has launched its most comprehensive and equitable response, thanks in part to partnerships with student, faculty and staff researchers from the UCLA Luskin School of Public Affairs.
Stories
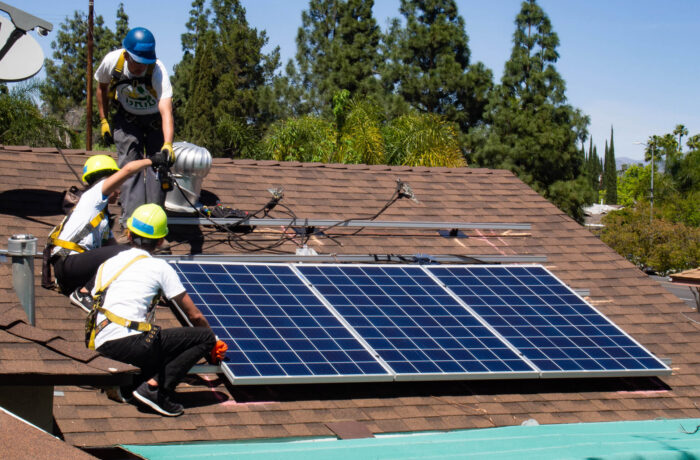

UCLA Teams Up With LADWP for Equitable Solutions To Reach 100% Renewable Energy
More than 20 UCLA faculty members and researchers continue to conduct research for the Los Angeles Department of Water and Power (as a result of a $2.6 million agreement set forth in 2022) to help the city achieve its goal of producing all of its energy from carbon-free and renewable energy sources by 2035 and doing so in ways that benefit all Angelenos equitably. A report is forthcoming later in 2023.
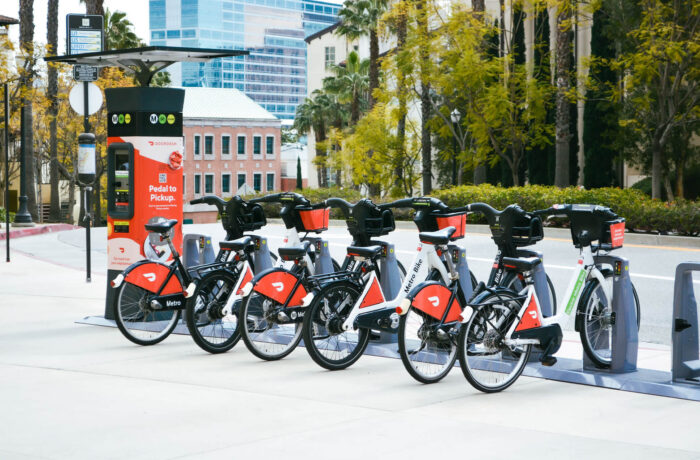
New Sustainable LA Grand Challenge Programming Gains TRACtion With Focus First on Transportation
The UCLA Sustainable LA Grand Challenge launched a new initiative to bring UCLA scholars together with community stakeholders to address a rotating list of four key topics related to sustainability: transportation, energy, water and ecosystems. The program, called TRACtion — for Transformative Research and Collaboration — began with a two-year series of activities and funding opportunities called Transforming Transportation in Los Angeles that will tackle the city’s seemingly intractable transportation challenges.
CLIMATE PROTECTION – EMISSIONS
* Interim goals for 2030, 2035 and 2040 to be developed through fossil-free planning that is underway at each location
** 90% direct reduction of total emissions from 2019 levels with residual emissions negated by carbon removal
Scope 2 emissions increased by almost 24% due to increased campus demand from new construction coming online as well as decreased electrical production in the cogeneration plant due to a steam turbine generator being offline for several months of repairs.
ENERGY – RENEWABLE energy use
ENERGY USE INTENSITY (EUI)
UCLA saw an increase in its EUI in 2022.
FOOD
of food and beverage purchases met sustainability criteria ($3.1M)
of food and beverage purchases were plant-based ($9.4M)
UCLA Dining increased its plant-based purchasing percentage in fiscal year 2022–23. It also increased spending on sustainable food and beverages by over $1.2 million from the previous year, representing an increase of over 100%. UCLA Housing’s sustainability and dining teams partnered with a Sustainability Action Research (SAR) team to find ways to improve sustainable food tracking. The teams implemented some of the SAR team’s findings when compiling this year’s data, allowing for previously missed sustainable items to be tracked.
Green building
During fiscal year 2022–23, UCLA’s Green Building program had 26 LEED projects in design or construction, including several community-oriented off-campus buildings, such as the historic Nimoy Theater and the James Lawson, Jr. Worker Justice Center at MacArthur Park. Gold certifications are anticipated soon for three campus buildings, while the restored Paul Revere Williams-designed Botany Building is seeking Platinum certification. In Westwood Village, four new LEED Gold apartment buildings opened to welcome 2,300 students, and several campus lab remodels will soon begin their design reviews.
17 Platinum, 33 Gold and 11 Silver
Total number of LEED certifications
procurement

green spend on electronics (72%)

green spend on cleaning supplies (51%)

green spend on indoor office furniture (95%)

green spend on office supplies (65%)
The University reports on green spend, as defined in the Sustainable Procurement Guidelines, and reached out to suppliers for spend data in four product categories for this year’s report.
Green spend is defined as meeting preferred or minimum criteria in UC’s Sustainable Procurement Guidelines.
Suppliers reporting: Electronics (9), Furniture (4), Cleaning supplies (6), Office supplies (3).
UC Systemwide Spend Analytics category data provided by CalUSource.
Sustainable Building & Laboratory Operations
Three new lab remodels are nearing completion and targeting LEED Gold certification (Boelter Robotics, Reed B-Level Labs and Molecular Sciences third floor). A fourth, in the recently restored Botany Building, is operating in accordance with Green Labs criteria.
total assessed green laboratories
Transportation
of students and employees on campus and at UCLA Ronald Reagan Hospital are utilizing alternative commuting methods
EV charging ports
of all vehicles acquired in 2023 were electric (zero-emission), plug-in hybrid or clean transportation fuel
Scope 3 commute emissions rose from approximately 31,000 metric tons in 2021 to 44,000 metric tons in 2022 due to a greater return to campus by the commuting population (the telecommute rate dropped to 25.9%).
WATER
*Based on a 3-year average of fiscal years 2005-08
**2025 goal is a 36% reduction from baseline
Includes UCLA Health
Water use was lower than pre-pandemic levels despite increases in campus square footage and population. In addition to ongoing water reclamation efforts, increased water conservation and turf conversions continued to reduce water use in landscaping. Native and drought-adapted plantings at both the newly restored Botany Building and Rosenfeld Hall help reduce water demand for irrigation and reduce site runoff volumes, while both projects also detain captured stormwater to partially supply irrigation needs.
ZERO WASTE – GENERATion
*These numbers might include a small amount of incineration that is being phased out.
The overall municipal solid waste (excluding construction and demolition) generated at UCLA in fiscal year 2022–23 increased by nearly 2,000 tons, a 13.96% increase from fiscal year 2021–22. The number of students and staff on campus increased due to continuing reintegration as the campus moves further out of the COVID pandemic adjustments. The 2022–23 year also saw an unusual influx of heavy rain periods, causing a mixture of water with the municipal solid waste (excluding construction and demolition) on campus. This inflates the weight in any open-top bins.
ZERO WASTE – DIVERsion
*Waste incineration was counted as diversion prior to July 2022.
While the overall municipal solid waste (excluding construction and demolition) increased at UCLA in fiscal year 2022–23, the percentage of diverted materials increased in conjunction with landfill items to maintain the diversion rate of 54% on campus (excluding construction and demolition) from 2021–22 to 2022–23. The efforts to ensure all landfill bins on-site are paired with a recycle and/or compost bin likely played a key role in informing users of sorting methods and increasing access to recycling and compost sorting locations.
Awards
In 2022, the Association for the Advancement of Sustainability in Higher Education announced that UCLA ranked fourth internationally in its tally of the Green Buildings Impact Area for STARS certification.
A full list of awards is featured on the UC Office of the President’s website.