
Climate
Read More About UC’s Progress on Climate
In July 2023, UC adopted stronger climate policy goals focused on direct action to reduce greenhouse gas (GHG) emissions. Decarbonization studies launched in 2023 are evaluating pathways for each campus and academic health center to meet those goals. During the past year, the University also advanced climate resilience planning, developed climate and environmental justice tools, and adopted an equity-weighted social cost of carbon for analyzing energy projects.
While GHG emissions rose in 2022, reflecting the impact of returning to work and school as COVID-19 pandemic restrictions eased, the University’s total net emissions remained 9% below pre-pandemic levels and 26% lower than when tracking began in 2009 (despite increases in enrollment and building square footage). In aggregate, net GHG emissions in 2022 increased 10% compared with 2021. This included an approximate 2% increase in scope 1 emissions, a 12% increase in scope 2 emissions and a 40% increase in scope 3 (commute and air travel) emissions. These numbers are based on reported emissions that will be verified by a third party by early 2024.
The updated climate action policy section aligns with science-based targets that require decarbonization no later than mid-century and supports the state’s latest climate goals. The new policy goals require each campus and its associated health system to reduce total (scope 1, scope 2 and identified scope 3) emissions 90 percent from 2019 levels by 2045 and neutralize any residual emissions through investments in carbon removal projects.
The new policy builds on the successes and lessons learned from the prior carbon neutrality policy, in place since 2015. Since then, UC made significant progress in reducing GHG emissions through programs such as UC’s Clean Power Program, which provides 100% clean electricity to seven campuses, and energy efficiency projects that have saved more than $400 million in energy costs.
The biggest remaining source of emissions is natural gas combustion for electricity, heating and cooling at UC locations. The State of California provided $12 million for each campus and academic health center to complete a decarbonization study by July 2024. The studies will produce an electrification strategy to achieve a 90% or greater reduction in natural gas consumption in campus energy systems.
Diversity, Equity, Inclusion and Justice
The Sustainable Practices Policy update, published in July 2023, for the first time integrates and prioritizes anti-racism, diversity, equity and inclusion principles into all of the University’s sustainable practices. To position the new goals and commitments for success, President Drake’s Global Climate Leadership Council funded an 18-month capacity building project that concluded in July 2023.
Read More About UC’s Progress on Diversity, Equity, Inclusion and Justice
More than 60 sustainability officers, staff and working group chairs participated in a comprehensive needs assessment and a series of workshops covering everything from foundational equity, diversity and inclusion skills to the history and current context of environmental justice issues nationally and in California. The project’s outcomes, including strategies and tools to improve equity analysis, recruitment, retention, communication and relationship-building, reflect a comprehensive approach to creating sustainable and just solutions on and off campus.
The systemwide Sustainability and Diversity, Equity, Inclusion and Justice Working Group that developed the new sustainability policy language also provided feedback and guidance for the Pathways to a Fossil Free UC Task Force sprint on equity and climate justice. The task force affirmed the critical connection between environmental sustainability and social justice by identifying equity dimensions for the state-funded decarbonization and electrification studies that each campus is currently developing or implementing.
These are just the first steps in the University’s commitment to addressing sustainability challenges through an inclusive and justice-oriented framework.
Energy
To continue to reduce its carbon footprint, the University is efficiently using its resources and changing the sources of energy that campuses and academic health centers consume.
Read More about uc’s progress on energy
Energy Efficiency
Energy efficiency and green building practices have reduced UC’s energy use intensity across its portfolio of buildings.

Cost savings in 2022

Cumulative cost savings since 2010
As a metric for relative efficiency, energy use intensity (EUI) is calculated by totaling all of the energy used by a location and dividing by the associated square footage. In 2022, UC locations continued their energy efficiency efforts while working to retain the energy use reductions realized from the coronavirus pandemic, now with increased occupancy and campus activity, resulting in flat year-over-year performance.
Renewable Energy and the UC Clean Power Program
The University of California ranks first among colleges and universities when it comes to green electricity use, according to the U.S. Environmental Protection Agency. In addition to over 55 megawatts of on-campus projects, the University has two operating utility-scale solar projects in California under contract — Five Points (60 megawatts) and Giffen Solar Park (20 megawatts) — and an additional 30-megawatt solar facility with a 15-megawatt battery expected to come online in 2025.
Earlier this year, the University of California signed its first-ever wind energy contract, the largest renewable energy commitment by the University to date in support of campus decarbonization. The contract with SunZia Wind is from a 3,500-megawatt wind project in New Mexico that will deliver electricity to California with help from a to-be-constructed 550-mile transmission line. The expected electricity generation from UC’s 85-megawatt portion of SunZia is equivalent to the total annual electricity consumption of UC Santa Cruz, UC Santa Barbara, UC Riverside and UC Merced combined.
Renewable energy from the project will be used by every UC campus and academic medical center. UC Clean Power — an electric service provider operating through California’s Direct Access Program — will use a significant portion to continue serving campuses with clean electricity. The project will be a key resource for the Clean Power Program to continue meeting the state’s Renewables Portfolio Standard and statewide energy sector greenhouse gas reduction targets.
Biogas
UC is the largest voluntary buyer of biomethane (methane from landfills and food waste) in the country. In 2023, the University began receiving biomethane from one landfill that was previously flaring the biogas; the biomethane from this project is equivalent to the amount of fossil natural gas UC Riverside consumes each year. Additionally, the University finalized an expansion of the biogas collection system at the Shreveport landfill, which resulted in an improvement in methane capture and biogas production. These projects bring UC to its goal of displacing 20% of the fossil gas currently used on campus with zero-carbon biomethane by 2025. This supply will sunset by 2040 as locations transition to other decarbonization solutions.
Food Service
of food and beverage purchases met sustainability criteria ($33.2M)
of food and beverage purchases were plant-based ($50.6M)
Read More About UC’s progress on Food Service
In fiscal year 2022–23, dining operations continued to ramp up with students returning to full-time in-person classes. Increased demand for food on campuses, as well as food supply chain disruptions and associated inflation, led to a 25% increase in food spend systemwide compared to the prior year. Spend on food purchases that met one or more sustainability criteria increased by 22% during the same period and represented 19% of the University’s food purchases. This amounts to over $33 million going to sustainable food suppliers, $6.1 million more than the previous year. Eight locations — four academic health centers and four campuses — were able to increase their percentage spend on sustainable food and beverages.
Of the University’s total food and beverage spend, 29%, or over $50 million, was on plant-based food items. Nine locations are already on track to meet the newly published policy goal of at least 25% spend on plant-based food by 2030.
In response to President Drake’s Leading on Climate Change priority, the Global Food Initiative Fellowship shifted focus to regenerative agriculture and sustainable food systems. In this pilot year, Sustainable Food Services Fellows will support campuses and academic health centers in their efforts toward President Drake’s goal of “defining the actions and resources needed to procure at least 25 percent of our own food supplies from sustainable sources by 2025, five years ahead of the University’s existing goal.”
In addition, University stakeholders established new goals for healthy beverages and food in vending machines at UC locations in the Health and Well-Being section of the Sustainable Practices Policy. The University continued collaborating on efforts to phase out single-use plastic and increase food recovery and security.
General Sustainability Performance Assessment
Read More about UC’s General Sustainability Performance Assessment
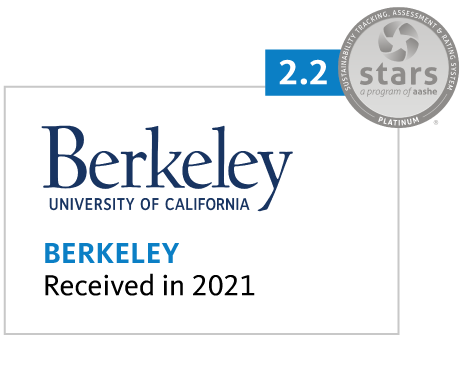
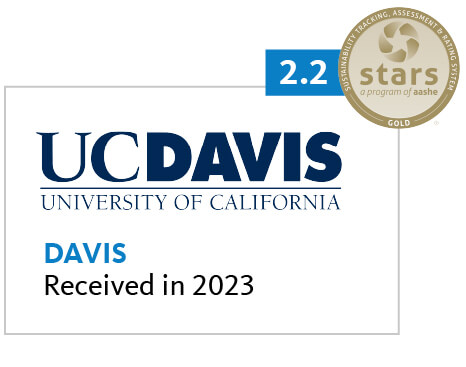
All nine undergraduate UC campuses participate in the Association for the Advancement of Sustainability in Higher Education’s Sustainability Tracking, Assessment and Rating System (AASHE STARS). The University’s General Sustainability Performance Assessment Working Group developed a policy update that was published in 2023 to raise the STARS rating requirement from Silver to Gold with an additional goal to strive for Platinum. In his Presidential Priorities Plan, President Drake’s Leading on Climate Change priority includes the curriculum subcategory in STARS as an indicator for his goal to “lead coordination of existing curricula and expand UC’s development of next-generation climate leaders.”
Six of the nine undergraduate campuses currently hold an AASHE STARS Gold rating. The other three undergraduate campuses, UC Merced, UC Berkeley and UC Irvine, have a Platinum rating and are scoring 90% or higher in the STARS curriculum subcategory.
STARS is the leading North American sustainable campus rating system and was developed by colleges and universities, including UC. The AASHE STARS Steering Committee guides the STARS development and implementation process and currently includes representation from the University’s sustainability staff. STARS is a transparent, self-reporting framework for colleges and universities to measure their sustainability performance. STARS provides the foundation for other campus sustainability rankings and is a primary standard by which peer institutions evaluate their overall achievements and progress in sustainability.
UC campuses, academic health centers and Lawrence Berkeley National Laboratory received many additional awards in fiscal year 2022–23.
Green Building
*Data reported only accounts for buildings certified through the first half of 2023
Read More about uc’s progress on green building
The University has 427 LEED certified green building projects (over 37 million square feet). Since the last report, UC added 19 new LEED certifications, including 10 LEED Platinum, five Gold, two Silver and two certified buildings.
UC no longer allows on-site fossil fuel combustion (e.g., natural gas) for space and water heating in new buildings or major renovations, except under special circumstances. The University currently has 24 occupied electric buildings (approximately 2.5 million square feet) and another 34 buildings (over 8 million square feet) in planning, design or under construction. These projects encompass all major building types.
In 2023, two significant updates were made to the green building section of the Sustainable Practices Policy. These included increasing the minimum LEED certification level from Silver to Gold and adopting a new requirement for new parking structures to achieve a Parksmart Silver certification. UC currently has two structures that have earned Parksmart Silver certification, one that achieved Gold certification and another five under construction that are pursuing certification. Additionally, the University increased the minimum number of LEED water efficiency credits that new buildings are required to earn from two to five points.
Health and Well-Being

The Sustainability and Well-Being Working Group is responsible for implementing the Health and Well-Being section of the UC Policy on Sustainable Practices. The working group collaborated with the Healthy Campus Network’s Faculty and Student Consortium to complete the Health in All Policies (HiAP) Executive Report on the UC Policy on Sustainable Practices.
Read More about uc’s progress on health and well-being
The HiAP process was driven by 10 undergraduate and graduate student fellows and their mentors, who assessed the Sustainable Practices Policy through a health-focused lens by reviewing existing language, published research and basic practices related to sustainability topic areas as well as by interviewing key stakeholders and experts.
In summer 2023, the Healthy Vending Guidelines were officially adopted into the UC Policy on Sustainable Practices. The working group also developed a draft UC Healthy Vending Best Practice Guide to assist campuses in implementing the new guidelines.
Procurement

green spend on electronics (52%)

green spend on cleaning supplies (58%)

green spend on indoor office furniture (97%)

green spend on office supplies (62%)
Green spend is defined as meeting preferred or minimum criteria in UC’s Sustainable Procurement Guidelines.
Suppliers reporting: Electronics (10), Furniture (5), Cleaning supplies (7), Office supplies (5).
UC Systemwide Spend Analytics category data provided by CalUSource.
Read More About UC’s Progress on Procurement
Despite global supply chain disruptions that continued into 2023 as a result of the COVID-19 pandemic, procurement staff mobilized to enable campuses and health centers to maintain research and teaching activities. UC is continuing to partner with its strategic suppliers on improving their sustainability practices and that of their supply chains. This year UC used the EcoVadis tool to obtain sustainability ratings for 304 suppliers, representing over $4 billion in spend. The sustainability ratings cover environmental practices, labor and human rights, ethics and sustainable procurement and can help begin a dialogue on aligning supplier practices with UC values.
The University analyzed data for $89 million in total spend from 27 strategic suppliers for the 2022–23 fiscal year. Within that spend, the University found that 52% of electronics, 97% of indoor office furniture, 58% of cleaning supplies and 62% of office supplies met UC’s requirements on minimum or preferred green spend, as outlined in the Sustainable Procurement Guidelines. This represents nearly $57 million in spend on products meeting green certification standards. The University looks forward to improving its data collection processes in future years. Analysis of UC’s support of small businesses, presented to the state each year, can be found online.
UC Code of Conduct for Trademark Licensees
While continued post-pandemic recovery occupied UC trademark licensing programs during 2022–23, UC campuses upheld as urgently as ever their commitments to workers and communities manufacturing UC-licensed products around the globe.
Notable social and environmental sustainability issues considered by the Code of Conduct for Trademark Licensees Steering Committee during the year included:
- Continued concern regarding imports presumed to be made by the forced labor of Muslim minority residents of the Xinjiang province of western China, with special focus on the Uyghur Forced Labor Prevention Act and its enforcement by U.S. Customs and Border Protection.
- Support for UC licensees sourcing their products from production facilities in Pakistan to sign the new Pakistan Accord for health and safety in the textiles and garment industry, a legally binding agreement for factory safety among apparel businesses, international unions, worker advocacy organizations and the International Labor Organization. Signatories include a growing list of licensee and international apparel brands.
- Actions by UC campuses to assist the nonprofit Worker Rights Consortium to ensure that the Trax Apparel factory in Cambodia offered reinstatement and back wages for union leader workers.
- Renewed efforts by UCLA and UC Berkeley to drive licensee sustainability through the EcoVadis Sustainability Assessment.
The global impact of the University of California’s licensed product manufacturing extends to 52 countries where more than 3,800 disclosed suppliers manufacture for 361 companies licensed to use university trademarks on products that are sold to the public.
Sustainable Building Operations and Laboratories
total assessed green laboratories
Read More about UC’s Progress on Sustainable Building operations and laboratories
All campuses have completed at least three assessments through their green lab assessment programs. By the end of fiscal year 2022–23, the cumulative number of laboratories certified as green by campuses totalled 375. This number represents an increase of 14% from the previous year. Systemwide, green lab certifications increased due to the lifting of many COVID restrictions, which had hindered much of the work in previous years. This year also represented the launch of the energy and water-efficient equipment incentive program funded through a partnership with Thermo Fisher Scientific, enabling 17 pieces of energy-intensive equipment to be replaced across the system. Collectively, campuses reported engagement with 1,711 individual researchers throughout the year.
Transportation
of students and employees are utilizing alternative commuting methods
EV charging ports
of all vehicles acquired in 2023 were electric (zero-emission), plug-in hybrid or clean transportation fuel
Read More about uc’s progress on transportation
In 2022–23, the overall (student and employee) single-occupancy vehicle (SOV) rate for the University of California was approximately 28%, meaning more than 70% telecommuted or commuted to campus by walking, biking, taking transit, or in a vanpool or carpool. This figure reflects the higher telecommuting rates that have persisted even after COVID-19 restrictions eased.
While telecommuting practices have remained steady over the last two years (much higher than pre-pandemic levels), many locations also saw employees and students return to other alternative commute modes such as carpooling, transit, walking and biking. In 2022–23, almost two-thirds of locations reported a decline in SOV commute rates from the past year. Similarly, over three-quarters of locations reported a decrease in SOV commuting from their 2015 baseline, and almost half the locations reported reductions that exceed the 2025 goal of reducing SOV commutes by 10% from 2015 rates.
Systemwide, 48% of all new fleet vehicles (light, medium and heavy-duty) acquired in fiscal year 2022–23 were battery-electric, plug-in hybrid or another qualifying clean transportation fuel vehicle. Starting in July 2023, alternatively powered vehicles must account for 50% of all vehicle acquisitions at each campus (regardless of vehicle size). Compliance with the new UC policy requirement for all sedan and minivan acquisitions to be zero-emission or plug-in hybrid vehicles will require significant change, but UC is making progress. Systemwide, 34% of all sedans and minivans acquired this year were alternatively powered. The state has mandated that 35% of new cars and light trucks sold in 2026 be zero-emission vehicles, and UC’s purchases are in line with that goal.
Over 1,800 active electric vehicle (EV) charging stations (and many more EV-ready locations) are installed at UC locations to support the conversion of fleet and commute vehicles to electric options.
UC Health
UC Health made significant strides toward a fossil-free future. Most academic health centers are in the planning, design or construction stages of buildings that will greatly reduce or eliminate the use of fossil fuels in their operations, including a medical center at UC Irvine Health, two outpatient surgery centers at UCSF Health and a hospital and outpatient pavilion at UC San Diego Health. UC Davis Health began decarbonizing its 26-megawatt natural gas cogeneration plant by partnering with the Sacramento Municipal Utility District to provide expanded and more reliable electrical service, an important step before transitioning to an all-electric system.
Read More about UC’s progress on health
In addition to the progress in new construction, each academic health center has begun a decarbonization study, in partnership with the campuses, to assess the technical and financial requirements to eliminate at least 90% of greenhouse gas emissions from their energy systems by 2045. UC Health worked locally and collaboratively to reduce greenhouse gas emissions from energy and anesthetic gas usage in resource-intensive operating room areas. The effort included reducing nitrous oxide usage, energy consumption and emissions from inhaled anesthetic gases.
UC academic health centers are developing equity-centered climate resilience plans as part of their commitment to decarbonizing the health sector through the White House/HHS Health Sector Climate Pledge.
Last year, the new UC Center for Climate, Health and Equity expanded its work in education, policy, research and health care sustainability. It trained over 100 faculty and reached 7,000 students with its climate-health courses, created wildfire patient care materials in English, Spanish and Chinese, assembled a course repository listing all climate-health courses within UC, attended and presented at international climate negotiations and launched its research on wildfire smoke and health impacts on vulnerable populations thanks to funding from the historic partnership with the state of California. The center also joined the National Academy of Medicine’s Climate Collaborative as a Network Organization, is serving on the National Academies Climate Security Roundtable and was appointed to the Joint Commission’s Environmental Sustainability Technical Advisory Panel. To complement these efforts, the UC Health section of the Sustainable Practices Policy was updated in 2023 to incorporate new sustainable procurement goals.
Water
Read More about uc’s progress on water reduction
Over the course of 2022 and into 2023, the UC Sustainable Water Systems Working Group collaborated with stakeholders across the system to develop new water policy commitments. The new policies increase LEED water credit requirements as well as require campus and academic health centers to complete water recycling and stormwater evaluations and take measures to provide easy access to drinking water.
While UC’s overall water use increased from the previous year, total water use per capita (excluding Agriculture and Natural Resources) remained at the same level as the prior year due to continued water conservation measures and irrigation water use restrictions during the drought. Progress in water conservation continues, as 10 UC locations exceeded their 2025 goal of reducing potable water use per person by 36%.
Zero Waste
*These numbers might include a small amount of incineration that is being phased out.
**In 2021, waste generation per weighted campus user spiked due to pandemic-related closures as base-level operations continued but the number of users on campus decreased.
*Waste incineration was counted as diversion prior to July 2022.
Read More about UC’s progress on zero waste
The 2022–23 academic year marked the first full year campuses returned to in-person instruction without pandemic closures. Most campuses were able to maintain steady diversion rates, while three campuses exhibited continued improvement. Overall, the University diverted 69% of its municipal solid waste and construction and demolition wastes from landfills.
Campuses have refocused on zero waste priorities now that they are able to move away from required COVID protocols. The University extended the deadline for the single-use plastic ban by one year, to June 2024, to allow campuses additional time to replace disposables with reusable and compostable options after emerging from the pandemic. In response to SB 1383 requirements, campuses are developing initiatives and programs to increase food recovery and organics recycling. Additionally, the University is assessing methods to calculate scope 3 greenhouse gas emissions from waste.