In fiscal year 2022–23, various groups across UCSF actively engaged staff and learners to support strong sustainability and climate action.
The Academic Senate hosted a town hall on sustainability titled “From Carbon Neutrality to Decarbonization — UCSF Opportunities” and a video was created to share broadly. Senior Vice Chancellor Erin Gore created the Fossil-Free Governance Committee to lead the $1.5 million state-funded decarbonization study.
Read More about Sustainability at UC San Francisco
Facilities Services implemented a SMART Labs project, LED lighting retrofits, metering and building controls. Facilities, Procurement and Sustainability partnered to expand the ultra-low-temperature freezer rebate program. UCSF Sustainability, Academic Senate and Transportation developed strategies to reduce business travel, increase the zero-carbon commute rate and install more electric vehicle charging stations. UCSF Real Estate designed a new hospital and research building to be 92% carbon-free while an all-electric parking garage and the Bayfront Medical Building will open in fiscal year 2024 with 100% clean power.
UCSF is the home of the UC Center for Climate, Health and Equity, which seeks to incorporate climate and health into the UC health curricula, and the EaRTH Center, which works to accelerate the discovery of harmful exposures and preventive solutions to improve health across the lifespan. In November 2022, UCSF staff made a presentation on taking action on climate to improve health“ at the 27th United Nations Framework Convention on Climate Change.
Many UCSF stories are shared on the sustainability website. The Annual Sustainability Awards ceremony returned this year to celebrate the UCSF community members who remain committed to sustainability despite the pandemic. Last, the second annual Waste to Art Competition was held to highlight the problems of waste in health care and academia.
Stories
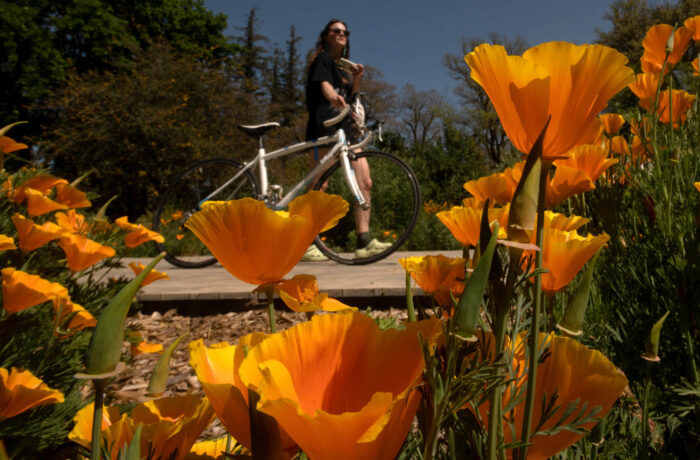

UCSF Bicycle and Micromobility Plan
In its commitment to build sustainable practices into all operations, UCSF created its first Bicycle and Micromobility Plan. The plan serves as a blueprint to help the campus increase its bicycle and micromobility programming, raise the proportion of people using these modes and improve access to these options. The plan’s coordinating committee included 20 representatives from across the University and surveyed over 850 stakeholders.
CLIMATE PROTECTION – EMISSIONS
* Interim goals for 2030, 2035 and 2040 to be developed through fossil-free planning that is underway at each location
** 90% direct reduction of total emissions from 2019 levels with residual emissions negated by carbon removal
Scope 1 emissions decreased in calendar year 2022 while, with the return to campus, scope 3 emissions increased as a result of greater commute and business travel (approximately 6,000 metric tons of carbon dioxide equivalent and 700 metric tons of carbon dioxide equivalent, respectively).
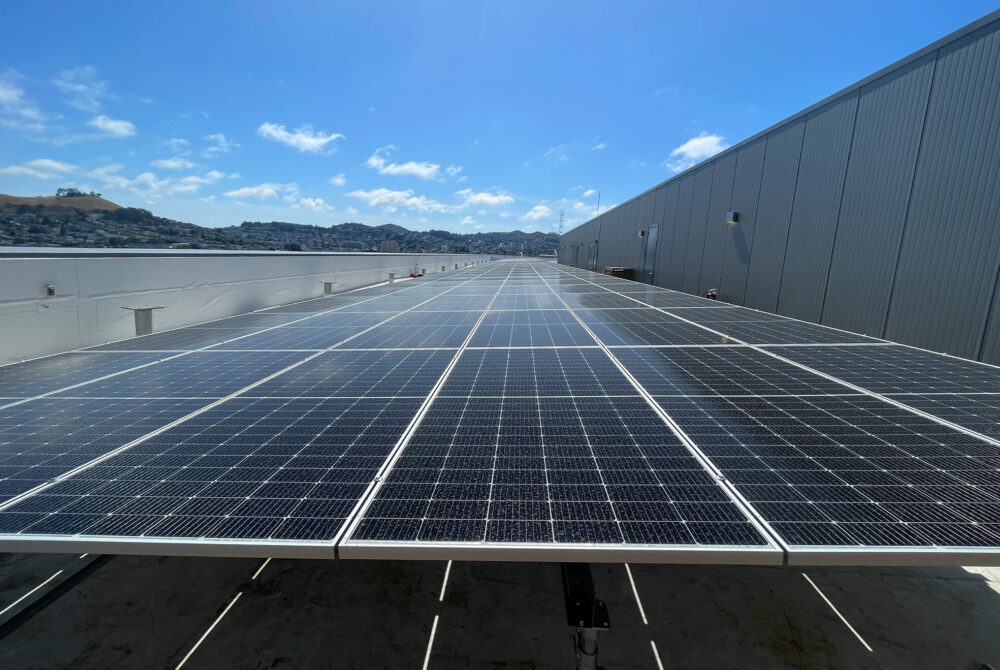
ENERGY – RENEWABLE energy use
ENERGY USE INTENSITY (EUI)
UCSF saw a decrease in its EUI in 2022.
FOOD
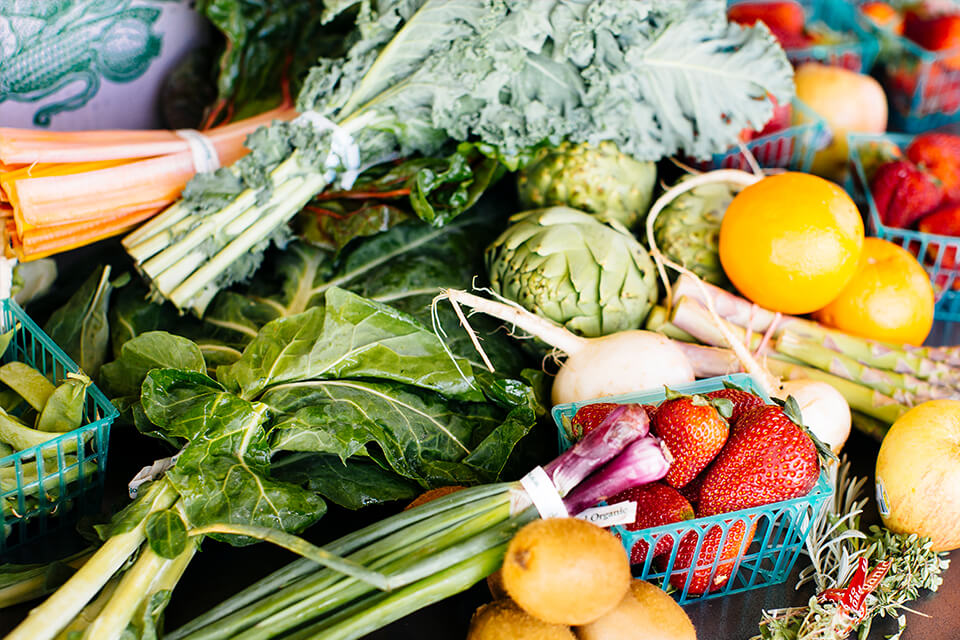
of food and beverage purchases met sustainability criteria ($520K)
of food and beverage purchases were plant-based ($361K)
UCSF’s retail food tenants experienced supply chain issues and challenges with the cost of sustainable food options. These tenants are recovering economically from the COVID years, adapting to changing demands due to patrons telecommuting and adopting different eating habits over the years (such as bringing food from home). UCSF’s sustainable food spend percentage of total food spend decreased 2.4% and may be affected by lack of supply or increased costs.
Green building
UCSF completed construction of its first Parksmart garage and is seeking Silver certification pending final documentation submittal in fiscal year 2023–24. The Bayfront Medical Building is an outpatient surgery center and clinic scheduled for completion and LEED Gold certification in fiscal year 2023–24.
16 Gold, 6 Silver and 5 Certified
Total number of LEED certifications
procurement

green spend on electronics (45%)

green spend on cleaning supplies (53%)

green spend on indoor office furniture (96%)

green spend on office supplies (58%)
The University reports on green spend, as defined in the Sustainable Procurement Guidelines, and reached out to suppliers for spend data in four product categories for this year’s report.
Green spend is defined as meeting preferred or minimum criteria in UC’s Sustainable Procurement Guidelines.
Suppliers reporting: Electronics (7), Furniture (3), Cleaning supplies (4), Office supplies (3).
UC Systemwide Spend Analytics category data provided by CalUSource.
Sustainable Building & Laboratory Operations
With its new Thermo Fisher funds, UCSF has signed up six labs to be Green Certified. UCSF is pushing for procurement restrictions that stop labs from purchasing non-Energy Star -80°C freezers. This restriction aligns with UCSF’s energy conservation policy. UCSF hopes to accelerate the replacement of all non-Energy Star -80°C freezers by enhancing its current rebates by next year.
total assessed green laboratories
Transportation
of students and employees are utilizing alternative commuting methods
EV charging ports
of all vehicles acquired in 2023 were electric (zero-emission), plug-in hybrid or clean transportation fuel
Scope 3 transportation emissions grew due to increases in commute (approximately 6000 metric tons of carbon dioxide equivalent) and business travel (approximately 700 metric tons of carbon dioxide equivalent) emissions with the return to on-campus activities.
WATER
*Based on a 3-year average of fiscal years 2005-08
**2025 goal is a 36% reduction from baseline
UCSF’s water use per capita in fiscal year 2022–23 was 59% lower than its baseline, representing an increase in water savings from last year.
ZERO WASTE – GENERATion
*These numbers might include a small amount of incineration that is being phased out.
UCSF’s total waste generated decreased due to the closing and consolidation of a few buildings where staff have mostly transitioned to hybrid or permanent remote status.
ZERO WASTE – DIVERsion
*Waste incineration was counted as diversion prior to July 2022.
UCSF’s waste diversion rate (without construction and demolition) fell 2% as labs increased activity in contrast with offices and event spaces. A pilot project to address lab plastics and increase waste diversion within the labs will be expanded in the coming year. The construction and demolition diversion rate likely decreased due to the completion of a number of large projects that diverted a lot of materials in previous years.
Awards
UCSF received recognition as a Best Workplace for Commuters in 2022.
A full list of awards is featured on the UC Office of the President’s website.