The UC Office of the President (UCOP) is the systemwide headquarters of the University of California that manages UC’s fiscal and business operations and supports the academic and research missions across its campuses, labs and health systems.
UCOP owns and leases spaces primarily in California, and also owns a building in Washington, D.C. (UCDC). In spring 2023, UCOP executed the second phase of the Return to Work program, with in-office anchor days for staff increasing to two days per week in the Oakland headquarters and other locations similarly ramping up in-person operations.
Read More about Sustainability at UC office of the president
UCOP continues to strive to improve the sustainability of its internal operations and model best practices. This year, two additional locations, 1100 Broadway and Morgan House, enrolled in clean energy purchasing programs, including the UC Clean Power Program and the East Bay Community Energy’s Renewable 100 rate schedule. More than one water leak was identified and remedied in 1111 Franklin, and in the future, UC Path and UCDC will further sub-meter their potable water infrastructure to more accurately identify discrepancies in consumption year over year. Additionally, a new composting program was launched at UCDC to divert the organic waste produced in the student apartments to local compost facilities.
Stories
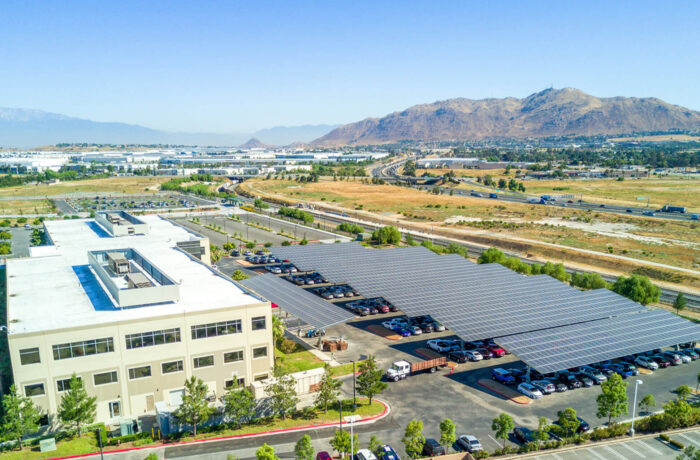

Optimizing Clean Energy Use at the UCPath Center
During winter 2022–23, the UCPath Center modeled decarbonization strategies to achieve a 90% reduction in natural gas consumption with only a 5% increase in electricity use compared to the previous year. This is attributed to the use of underfloor electric resistance zone reheat coils and fans to supply the heating capacity typically provided by gas-powered rooftop units.
CLIMATE PROTECTION – EMISSIONS
* Interim goals for 2030, 2035 and 2040 to be developed through fossil-free planning that is underway at each location
** 90% direct reduction of total emissions from 2019 levels with residual emissions negated by carbon removal
UCOP’s greenhouse gas emissions increased in 2022 as employees returned to the office and resumed business travel. UCOP’s scope 1 emissions increased 23% due to greater natural gas, fuel and refrigerant use. New building operating procedures will reduce fossil fuel-derived resource usage (e.g., shifting to electric heating and curtailing natural gas consumption in boilers). UCOP’s scope 2 emissions decreased 87% due to building consolidation efforts and the associated transition to purchased carbon-free electricity through UC’s Clean Power Program. UCOP’s scope 3 emissions more than doubled in 2022 with employees resuming commuting and business travel; however, estimated scope 3 emissions remain 76% lower than pre-pandemic levels.
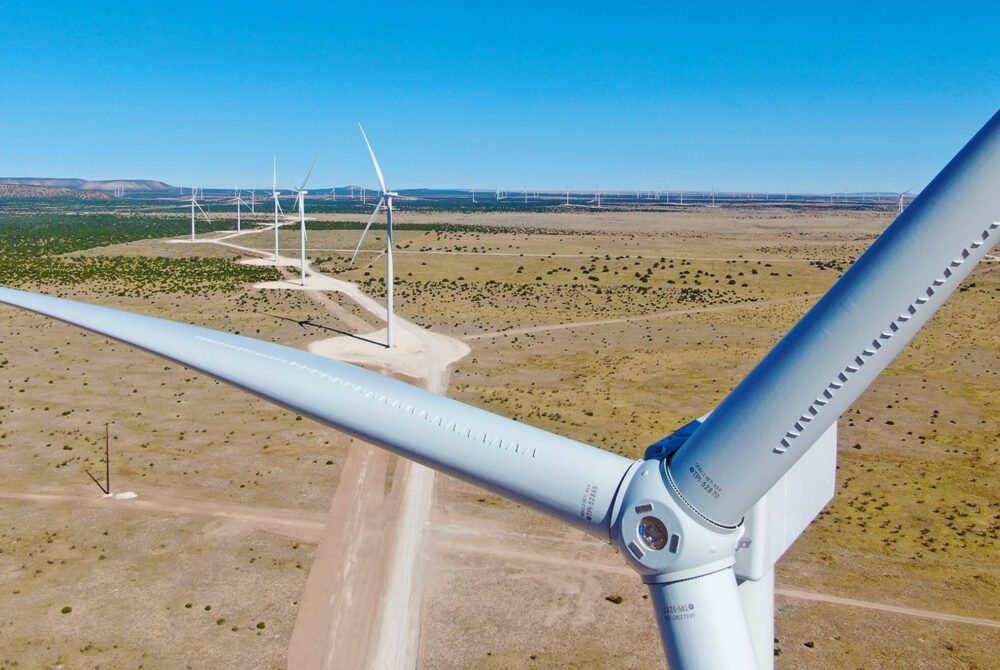
ENERGY – RENEWABLE energy use
ENERGY USE INTENSITY (EUI)
UCOP saw an increase in its EUI in 2022 due to a phased return to on-site operations.
Green building
No UCOP locations earned green building certifications in fiscal year 2022–23.
1 Platinum, 2 Gold and 2 Silver
Total number of LEED certifications
procurement

green spend on electronics (72%)

green spend on cleaning supplies (78%)

green spend on indoor office furniture (99%)

green spend on office supplies (36%)
The University reports on green spend, as defined in the Sustainable Procurement Guidelines, and reached out to suppliers for spend data in four product categories for this year’s report.
Green spend is defined as meeting preferred or minimum criteria in UC’s Sustainable Procurement Guidelines.
Suppliers reporting: Electronics (4), Furniture (2), Cleaning supplies (2), Office supplies (2).
UC Systemwide Spend Analytics category data provided by CalUSource.
Transportation
UCOP employees began returning to the office during this reporting period. In early 2023, the Oakland offices instituted a program to bring employees into the office on the same two days each week. These changes contributed to a shift in estimated commute modes, notably a reduction in telecommute rates and an increase in the percentage of employees using alternative commute modes. These findings were estimated based on data sources such as parking and commuter benefits enrollment. UCOP hopes to conduct a full commuter survey as post-pandemic operations normalize.
of employees are utilizing alternative commuting methods
EV charging ports
WATER
*Based on a 3-year average of fiscal years 2005-08
**2025 goal is a 36% reduction from baseline
With the partial return to work, UCOP saw a significant increase in total potable gallons consumed compared to fiscal year 2021–22, although water use was lower than it was in fiscal year 2019–20. While total water use increased, UCOP reduced its water consumption per capita by 7% compared to last year due to more staff being on-site. Methodological changes pertaining to estimating meter readings also impacted year-over-year results.
ZERO WASTE – GENERATION
*These numbers might include a small amount of incineration that is being phased out.
Boundary changes give cause to difference in values from previous years (i.e. leased buildings).
Year-over-year comparisons are difficult due to changes in calculation methods and the lack of recent waste audits during the pandemic. The available data show that UCOP’s per capita waste generation increased from 2.2 to 2.6 pounds per person this year. This estimate could be attributed to more staff returning to the office as pandemic restrictions eased. Additionally, at the UC Washington Center, student enrollment — and the associated waste generated — dramatically increased as residential programs returned.
ZERO WASTE – DIVERsion
*Waste incineration was counted as diversion prior to July 2022.
UCOP reported an estimated municipal solid waste diversion rate of 59%, roughly the same as fiscal year 2021–22. Including construction and demolition, the total diversion rate was 64%. As UCOP renovated and prepared to open the new UC Center Sacramento, 94 tons of construction and demolition waste were diverted from the landfill.