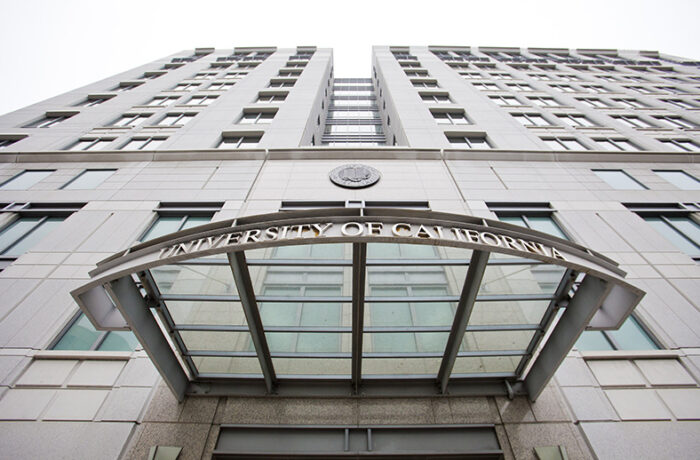
The UC Office of the President (UCOP) is the systemwide headquarters of the University of California that manages UC’s fiscal and business operations and supports the academic and research missions across its campuses, labs and health systems. UCOP owns and leases space primarily in California, but also has properties in Washington, D.C., and Mexico City.
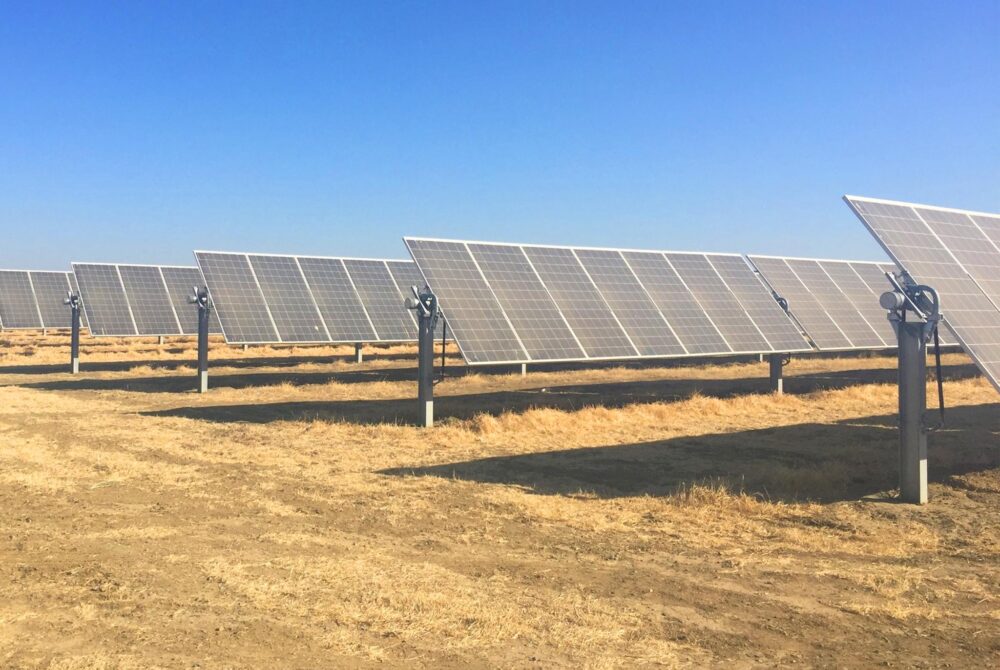
On the climate front, UCOP observed a decrease of more than 13% in greenhouse gas emissions in 2019. This reduction was achieved primarily by increasing the use of carbon-free electricity. For example, UCOP’s scope 2 greenhouse gas emissions from purchased electricity dropped 35% due to the carbon-free electricity that UCOP headquarters at 1111 Franklin Street in Oakland and its Washington, D.C., property received. A solar photovoltaic system was also installed at the UCPath Center in Riverside, California.
Other milestones from the past year include the launch of the UCOP Sustainability Affinity Group, an employee-led group focused on monitoring UCOP’s sustainability data and increasing sustainability practices within UCOP.
The COVID-19 shutdown impacted UCOP’s sustainability data for this reporting year. For instance, the drop in employee commute rates skews UCOP’s commute rate data downward. (Data was reported with the assumption that no more than 10% of employees were commuting to UCOP buildings daily.) While a similar downward trend in water use was expected, UCOP locations observed an increase in water usage in fiscal year 2019-20.
In fiscal year 2020-21, UCOP will consolidate its Oakland offices into two buildings. This consolidation is expected to save money, increase employee well-being and bring UCOP closer to meeting UC’s sustainability goals through a smaller office footprint.
Stories

UCOP Headquarters’ Energy Savings During Shelter-in-Place
In March 2020, UCOP transitioned to a telecommute and limited on-site operations status due to the COVID-19 pandemic. This shift left UCOP’s offices across California and Washington, D.C., nearly empty. UCOP’s headquarters, 1111 Franklin, observed the largest impact from this transition, as more than 700 employees suspended their daily commutes to the building. UCOP took […]
CLIMATE PROTECTION – EMISSIONS
ENERGY – RENEWABLE ELECTRICITY GENERATION
ENERGY USE INTENSITY (EUI)
Transportation
The Office of the President continued to make strides in its efforts to use alternative transportation methods.

of UCOP employees are utilizing alternative commuting methods
Water
ZERO WASTE – GENERATED
ZERO WASTE – DIVERTED
procurement

green spend on indoor office furniture

green spend
on cleaning supplies
The Office of the President’s goals for procurement include 25% green spend on electronics and indoor office furniture, and 75% green spend on cleaning supplies.
Green building
The Office of the President’s total LEED certifications speak to its commitment to sustainability.
1 Platinum, 1 Gold and 2 Silver
Total number of LEED certifications