In 2020, UC Santa Barbara took several sustainability actions that also contribute to positive human health outcomes.
For example, it signed a pledge through the Center for Environmental Health to commit to purchasing safer furniture products to protect the health of the community and the global environment. The campus also replaced nearly all of its gas-powered grounds tools with electric models. This switch not only reduces greenhouse gas emissions but helps mitigate workers’ respiratory health issues by reducing the inhalation of exhaust, toxins and dust.
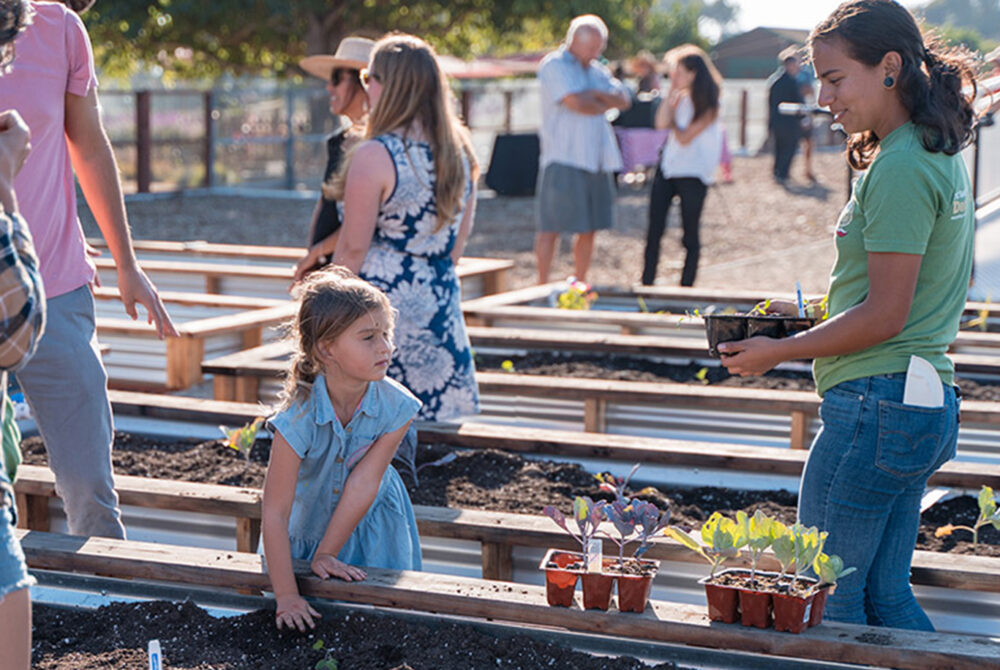
In spring 2020, UC Santa Barbara’s Edible Campus Program Student Farm (a partnership of the Associated Students Department of Public Worms, Associated Students Food Bank and the Sustainability Program) was determined to be an essential service and maintained operations through the COVID-19 pandemic. Portola Dining Commons also launched a food recovery program managed by Housing, Dining, and Auxiliary Enterprises.
Additionally, Santa Barbara’s total operational greenhouse gas emissions were about 20% below 1990 levels, despite a near doubling in square footage. The campus expects to see its operational greenhouse gas emissions drop almost 50% in the upcoming year as it procures more clean electricity. In July 2020, UC Santa Barbara joined the UC Clean Power Program, which provides 100% carbon-free power.
Last year the campus ramped up climate education with the launch of the UC-CSU Knowledge Action Network (KAN) NXTerra Digital Platform and Knowledge Action Network, co-directed by Dr. John Foran, a distinguished UCSB professor of sociology and environmental studies. The UC-CSU KAN for Transformative Climate and Sustainability Education and Action is a collaborative effort of UC and California State University educators to scale and intensify California students’ literacy in climate change, climate justice, carbon neutrality, greenhouse gas emissions reductions and critical sustainability.
Stories
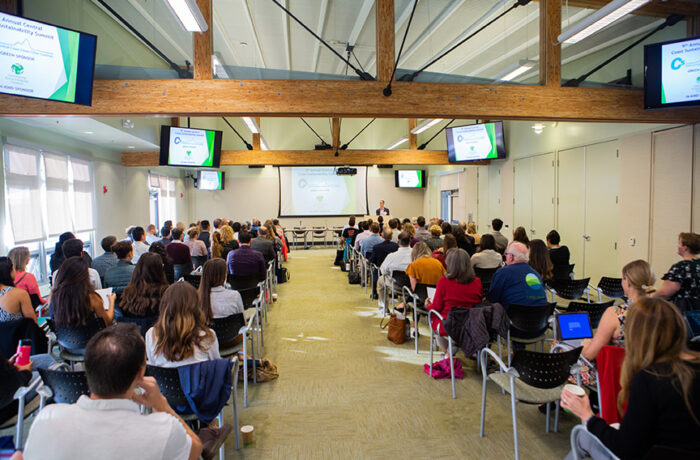

Shifting Conference Culture
The annual California Higher Education Sustainability Conference (CHESC), typically hosted at UC Santa Barbara, went 100% virtual for the first time in its 19-year history. This rapid change was a direct result of the COVID-19 pandemic. The conference steering committee retooled months of conference planning and challenged all of the assumptions around audience participation built […]
CLIMATE PROTECTION – EMISSIONS
ENERGY – RENEWABLE ELECTRICITY GENERATION
ENERGY USE INTENSITY (EUI)
Transportation
UC Santa Barbara continued to make strides in its efforts to use alternative transportation methods and support the use of electric vehicles in 2020.

of UCSB employees are utilizing alternative commuting methods

EV charging stations at this location for 2019-2020

of light-duty vehicles acquired in 2020 were electric (zero-emission) and hybrid vehicles
WATER
ZERO WASTE – GENERATED
ZERO WASTE – DIVERTED
Food
UC Santa Barbara continues to set ambitious goals, with a goal for 2030 of 25% spend on sustainable food and beverages.

total spend on food and beverages
of food and beverage purchases met sustainability criteria in fiscal year 2019-20
procurement

green spend on indoor office furniture

green spend
on cleaning supplies

green spend on electronics
UC Santa Barbara’s goals for procurement include 25% green spend on electronics and indoor office furniture, and 75% green spend on cleaning supplies.
Green building
UC Santa Barbara’s total LEED certifications speak to its commitment to sustainability.
14 Platinum, 40 Gold, 15 Silver and 2 Certified
Total number of LEED certifications
Sustainable Building & Laboratory Operations
total assessed research labs
UC Santa Barbara has met the goal of assessing three labs.
Awards
UC Santa Barbara was the proud recipient of an AASHE STARS Gold rating in 2020.
A full list of awards is here.