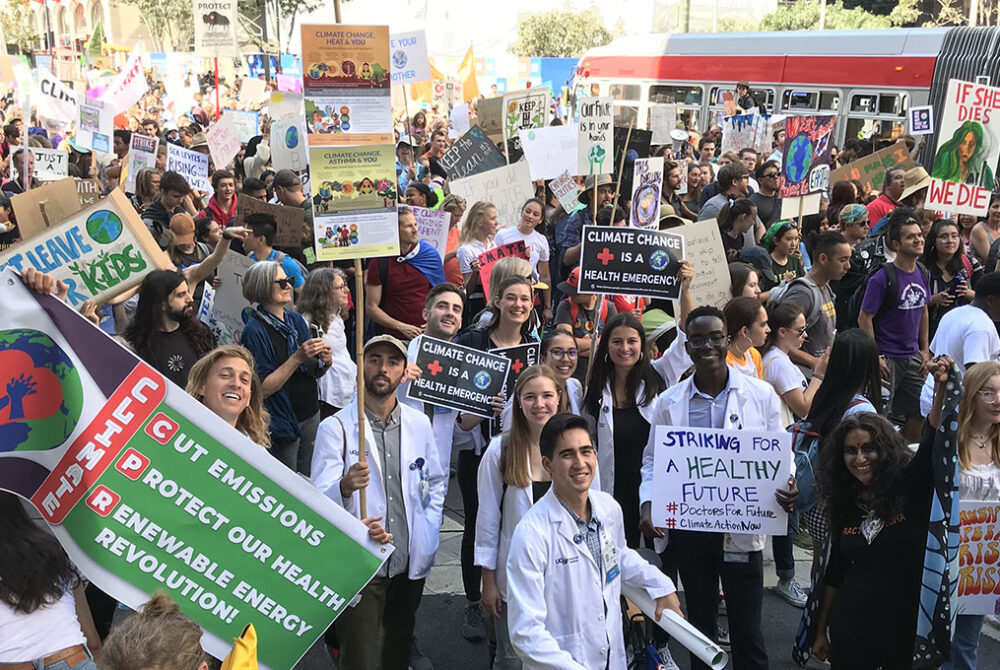
UC San Francisco recognizes the urgency of addressing the human health impacts of the climate crisis. This past fiscal year, the institution has made significant strides in integrating the climate-health connection into its graduate health care education, research and patient care mission.
A Climate Crisis Is a Health Crisis, a main feature of the December 2019 issue of UCSF Magazine, focused on six faculty members’ pioneering work of linking the physical and psychological costs of climate-related disasters and how they incorporate climate change into the curriculum and guide the health sector to address the issue.
UCSF’s newly formed Climate and Health Center is convening a transdisciplinary community of practice to drive cutting-edge climate health research and education, promote health system sustainability and bring health evidence to climate policy in order to improve the health, well-being and equity of all communities. A newly created EaRTH Center, funded by the National Institute of Environmental Health Sciences, is working to integrate environmental health into the medical school curriculum. And the Human Health and Climate Change student group developed a Planetary Health Justice Report Card that grades U.S. and Canadian medical schools on how well they address the intersection of health and the environment.
In addition to these academic efforts, climate mitigation of campus and health system operations is ongoing. Sustainability work groups continue to focus on energy efficiency, green buildings and smart sustainable campus planning. Green Lab campaigns promoted Energy Star-certified freezers, and the 10th Annual Anniversary Sustainability Awards recognized green champions and work groups. New climate actions this year included the purchase of carbon-free electricity from the San Francisco Public Utilities Commission, installation of the 10th solar project and the construction of UCSF’s first all-electric housing buildings.
Stories

Preparing for Power Shutoffs
In 2019, Public Safety Power Shutoffs (PSPS) impacted or threatened to impact many campus and health system operations. UCSF created a new Lab Services Initiative to provide centralized lab equipment maintenance, temperature monitoring and bracing to protect UCSF’s invaluable research assets. UCSF resilience planning also included the chancellor and other leaders from the UCSF campus […]
CLIMATE PROTECTION – EMISSIONS
ENERGY – RENEWABLE ELECTRICITY GENERATION
ENERGY USE INTENSITY (EUI)
Transportation
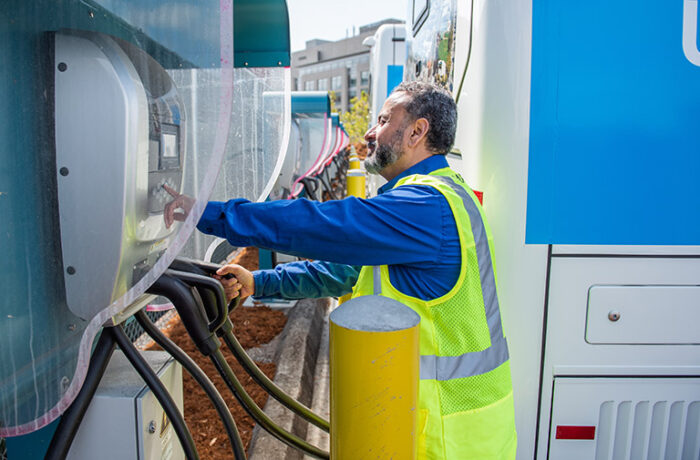
UCSF and UCSF Health continued to make strides in their efforts to use alternative transportation methods and support the use of electric vehicles in 2020.

of UCSF employees, including those at UCSF Health, are utilizing alternative commuting methods

EV charging stations at UCSF and UCSF Health for 2019-2020
Water
ZERO WASTE – GENERATED
ZERO WASTE – DIVERTED
Food
UC San Francisco continues to set ambitious goals, with a goal for 2030 of 25% spend on sustainable food and beverages.

total spend on food and beverages
of food and beverage purchases met sustainability criteria in fiscal year 2019-20
procurement

green spend on indoor office furniture

green spend
on cleaning supplies

green spend on electronics
UC San Francisco’s goals for procurement include 25% green spend on electronics and indoor office furniture, and 75% green spend on cleaning supplies.
Green building
UC San Francisco’s total LEED certifications speak to its commitment to sustainability.
11 Gold, 6 Silver and 5 Certified
Total number of LEED certifications
Sustainable Building & Laboratory Operations

total assessed research labs
UC San Francisco has met the goal of assessing three labs.