This year, UC Riverside has made significant progress toward achieving the goals set forth in the systemwide Sustainable Practices Policy.
This included meeting two goals five years early:
- A reduction in per capita waste generation to 0.74 pounds, well below the 2025 target of 1.04 pounds.
- A reduction in per capita water use, to just over 45% from the baseline against the goal of 36% from the baseline by 2025.
Overall, the campus saw a reduction in greenhouse gas emissions of just over 13.5%, largely driven by a reduction in commute emissions by over 39% over the last four years and the work of the local public utility provider to find cleaner sources of energy. This year, solar generation provided close to 9% of UC Riverside’s total electricity usage, and plans are underway to add additional solar photovoltaics to campus rooftops in the coming year. This year also marked the start of construction on Riverside’s first all-electric building, the North District.
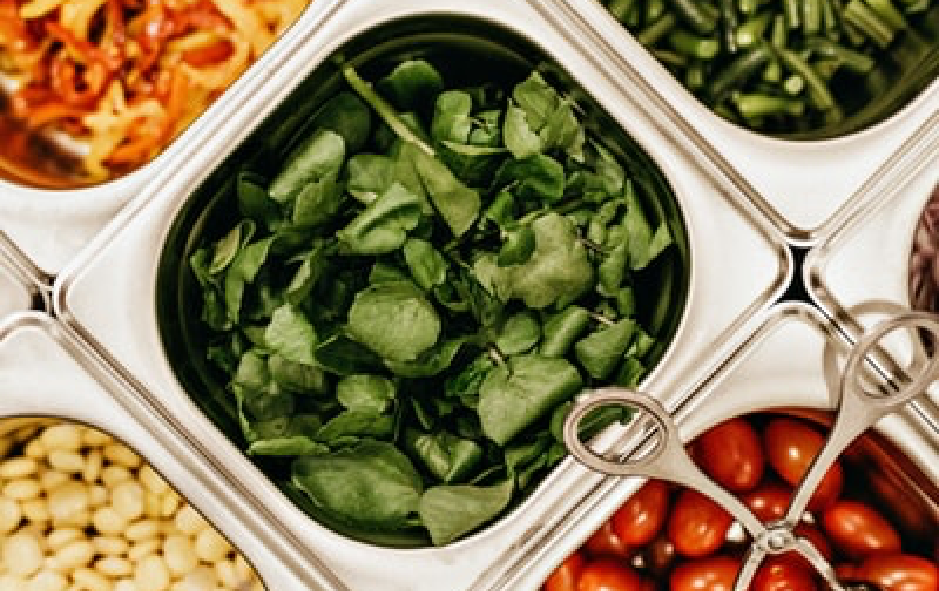
UC Riverside’s campus food service efforts have continued to improve. In fiscal year 2019-20, about 6% of the campus’s food procurement was sustainable, a 1% increase over last year, and 20% of spend was on plant-based foods. Additionally, Dining Services on campus recovered 17,720 pounds of food for donations this year, with distribution to the R’Pantry, the campus food pantry, and to a local nonprofit.
The transportation sector has seen significant reductions due to initiatives like a vanpool program that recorded nearly 1.3 million miles driven, with an average of 4.7 passengers per trip. Another initiative, the U-PASS program with the Riverside Transit Agency, which allows students, staff and faculty to ride public transit for free, saw an increase of 18% over the past year, with a total of 626,699 boardings.

Stories
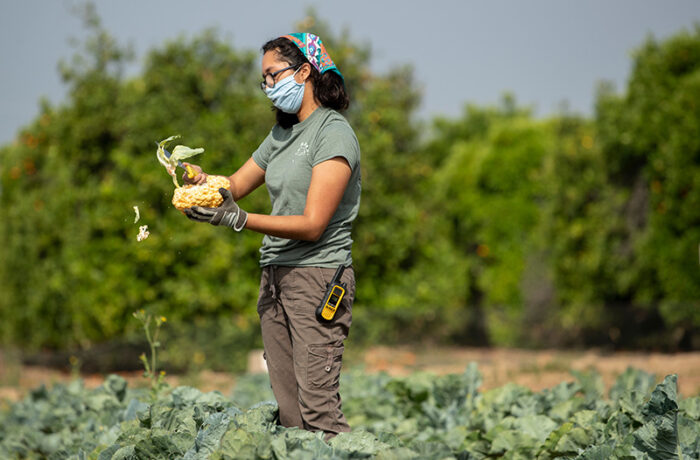

From UC Riverside’s Garden to Students’ Tables
COVID-19 has left most of the campus closed, but the harvesting has continued at R’Garden, and fresh fruits and vegetables are going to students who have remained on campus. Anthony “Tony” Ruiz, a fourth-year student majoring in ethnic studies and one of two Green Campus Action Plan interns working at R’Garden, said he feels enormous […]
CLIMATE PROTECTION – EMISSIONS
ENERGY – RENEWABLE ELECTRICITY GENERATION
ENERGY USE INTENSITY (EUI)
Water
ZERO WASTE – GENERATED
ZERO WASTE – DIVERTED
Transportation
of UCR employees are utilizing alternative commuting methods

EV charging stations at this location for 2019-2020
of light-duty vehicles acquired in 2020 were electric (zero-emission) and hybrid vehicles
UC Riverside continued to make strides in its efforts to use alternative transportation methods and support the use of electric vehicles in 2020.
Food
UC Riverside continues to set ambitious goals, with a goal for 2030 of 25% spend on sustainable food and beverages.
total spend on food and beverages
of food and beverage purchases met sustainability criteria in fiscal year 2019-20
procurement

green spend on indoor office furniture

green spend
on cleaning supplies

green spend on electronics
UC Riverside’s goals for procurement include 25% green spend on electronics and indoor office furniture, and 75% green spend on cleaning supplies.
Green building
UC Riverside’s total LEED certifications speak to its commitment to sustainability.
1 Platinum, 4 Gold, 1 Silver and 1 Certified
Total number of LEED Ccertifications
Sustainable Building & Laboratory Operations

total assessed research labs
UC Riverside has met the goal of assessing three labs.
Awards
UC Riverside was the proud recipient of an AASHE STARS Gold rating in 2020.
A full list of awards is here.