Lawrence Berkeley National Laboratory (Berkeley Lab) is a Department of Energy Office of Science research laboratory operated by UC. Sustainability performance highlights from the last year include:
Maintained energy savings: The Lab maintains a portfolio of energy and water savings that totaled, as of fall 2021, 13 million kilowatt-hours (electricity and natural gas, weather-corrected). These savings are equivalent to the generation of a 8.4-megawatt solar array, which would occupy 33 acres. The savings are primarily driven through improvements in building operations, delivered by a dedicated ongoing commissioning team. Much of this savings is being generated through improvements in building operations, driven by a dedicated ongoing commissioning team.
Measured energy savings: The Lab’s total weather-corrected non-process energy use intensity was 26% lower than in 2015.
Green house gas emissions: Total reported greenhouse gas emissions as of October 2020 were 46% below 2015 levels.
ISO 50001: In September 2020, the Lab received third-party certification of its energy and water management practices against ISO 50001, an international energy management standard.
New construction: The Lab continues sustainability practices established with its electrified Integrative Genomics Building, a 2020 UC Best Practice Award winner for Overall Sustainable Design. Two more buildings at the Lab have completed design and feature all-electric heating and cooling.
The Lab has operated at a capacity of 20 to 25% during the UC fiscal year due to COVID-19. Even with lower occupancy, many facilities have remained in operation. This has produced discontinuities in water use intensity data, which is normalized by population. With lower onsite populations, waste diversion performance has been difficult to measure reliably.
Stories

Empowering a Neighborhood to Breathe Easy
Berkeley Lab’s black carbon sensors enable air quality monitoring to understand the impacts of diesel trucks in Richmond, California.
How to Accelerate Solar Adoption for the Underserved
A Berkeley Lab study finds certain policies and business models can lead to more equitable distribution of solar installations.
CLIMATE PROTECTION – EMISSIONS
Berkeley Lab reduced its greenhouse gas emissions for federal fiscal year 2020 (the 12 months through September 2020) by 46% from a fiscal year 2015 baseline. This accomplishment exceeds the currently proposed near-term national climate mitigation goal of a 50% to 52% greenhouse gas emissions reduction from 2005 levels by 2030. Reduction in total emissions can be attributed to a significant decrease (about 50%) in scope 3 emissions from the previous year associated with fewer employees commuting and a decrease in air travel due to COVID-19. Further, a 26% reduction in scopes 1 and 2 emissions from the previous year puts Berkeley Lab on the path to achieving its 30% reduction in total greenhouse gas emissions by 2025 goal from a 2015 baseline. (Berkeley Lab follows federal reporting protocols, which include forms of verification, but does not pursue third-party verification.)
ENERGY USE INTENSITY (EUI)
Berkeley Lab saw a decrease in its EUI in the calendar year 2020.
Green building
Berkeley Lab’s Integrative Genomics Building (IGB) received LEED Gold certification. This building replaces the previously leased Joint Genome Institute facility in Walnut Creek that the Lab vacated in January 2020. The new IGB uses only electricity for space and water heating and is the first of the three planned electrified buildings at the Lab. IGB is exceeding its design target for deep energy efficiency, operating at 31% of the UC building energy benchmark.
1 Platinum and 6 Gold
Total number of LEED certifications
Transportation
Berkeley Lab has over 2,100 parking spaces on the main site and a total of 30 active electric vehicle (EV) charging spots or stations, 16 of which are Level 2 that operate at 240 volts. The Lab’s EV charging program has an active membership of 190 people on average for the reported year. Utilization of the EV charging spots declined in 2020 because of the COVID-19 pandemic but is increasing gradually as more employees come back to work on-site. The Lab also purchased seven light-duty fleet vehicles, two of which are hybrid electric vehicles.
of light-duty vehicles acquired in 2021 were electric (zero-emission) or hybrid vehicles

EV charging stations at this location for 2020-2021
water
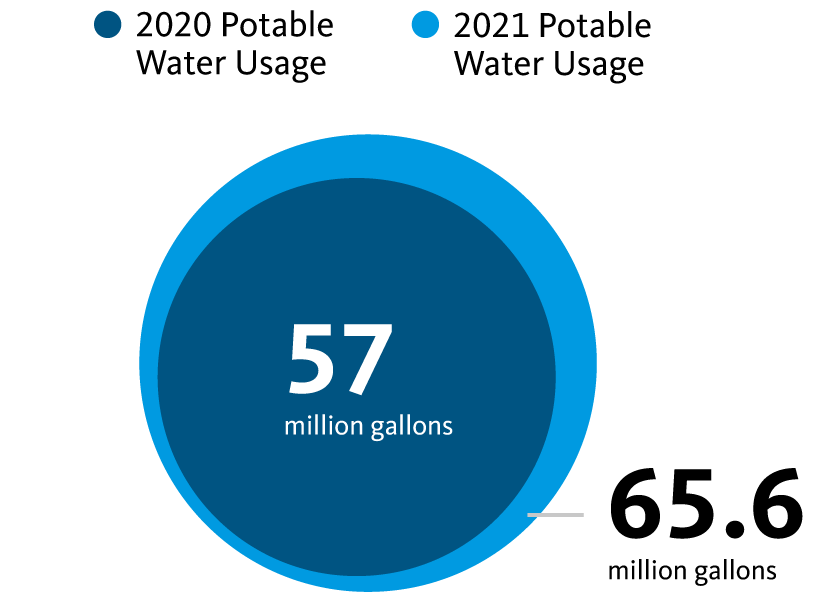
Water consumption at Berkeley Lab increased by about 9.8 million gallons from the previous year’s reporting period. Berkeley Lab has utilized daily badge access data for estimating the average weighted campus user (WCU) of the main hill site for the 2020–21 fiscal year. The WCU for the reporting period was 707, down from 5,195 in the previous year. Water consumption intensity, calculated as gallons per square feet, was 33.5 gallons per square foot compared to 27.7 gallons per square foot the previous year. This year’s report illustrates the difference in water consumption between fiscal year 2019–20 and fiscal year 2020–21 instead of measuring progress toward the 2025 goal.
ZERO WASTE – GENERATion
Berkeley Lab generated 663 tons of waste and diverted 464 tons of waste. Compost decreased significantly compared to pre-pandemic operations as the cafeteria was not operating for the majority of the year and was operating at significantly reduced capacity when it was open. Landfill increased compared to pre-pandemic operations because on-site activity was dominated by laboratory uses, which generate more landfill waste than normal office operations.
ZERO WASTE – DIVERsion
Compost decreased significantly compared to pre-pandemic operations as the cafeteria was not operating for the majority of the year and was operating at significantly reduced capacity when it was open. Landfill increased compared to pre-pandemic operations because on-site activity was dominated by laboratory uses, which generate more landfill waste than normal office operations.
Awards

The Lab received two Department of Energy Sustainability Awards in 2021: Innovative Approach to Sustainability and Strategic Partnerships for Sustainability.
A full list of awards from 2021 for each UC location is featured on the UC Office of the President’s website.