UC Merced’s biggest sustainability milestone was announcing achievement of its campus carbon neutrality goal of 2020. Building on the early sustainability successes with energy-efficient buildings and completion of its first solar array, in 2009, the campus committed to achieving carbon neutrality by 2020, five years earlier than the UC systemwide goal of 2025.
In December 2020, after publicly reporting 2018 emissions data and completing third-party verification through The Climate Registry, the campus announced that it had achieved carbon neutrality for 2018 emissions, two years earlier than planned.
To help the campus with its ongoing sustainability commitments, Merced continued with green lab and office programs by certifying lab and office spaces for their environmental performance. These programs focused on reducing energy, water and waste, as well as sustainable procurement.
CLIMATE PROTECTION – EMISSIONS
As UC’s newest campus, UC Merced had set a more aggressive goal to achieve climate neutrality for scopes 1 and 2 sources by 2020. Emissions remained flat last year despite an increase in the number of buildings that came online from the Merced 2020 Project. The campus was not operating at full capacity during the pandemic. (At the time of data collection, campus greenhouse gas emissions were not yet third-party verified. Updates will be made, as needed, in future reports.)
ENERGY – RENEWABLE ELECTRICITY GENERATION
ENERGY USE INTENSITY (EUI)
UC Merced saw an increase in its EUI in the calendar year 2020.
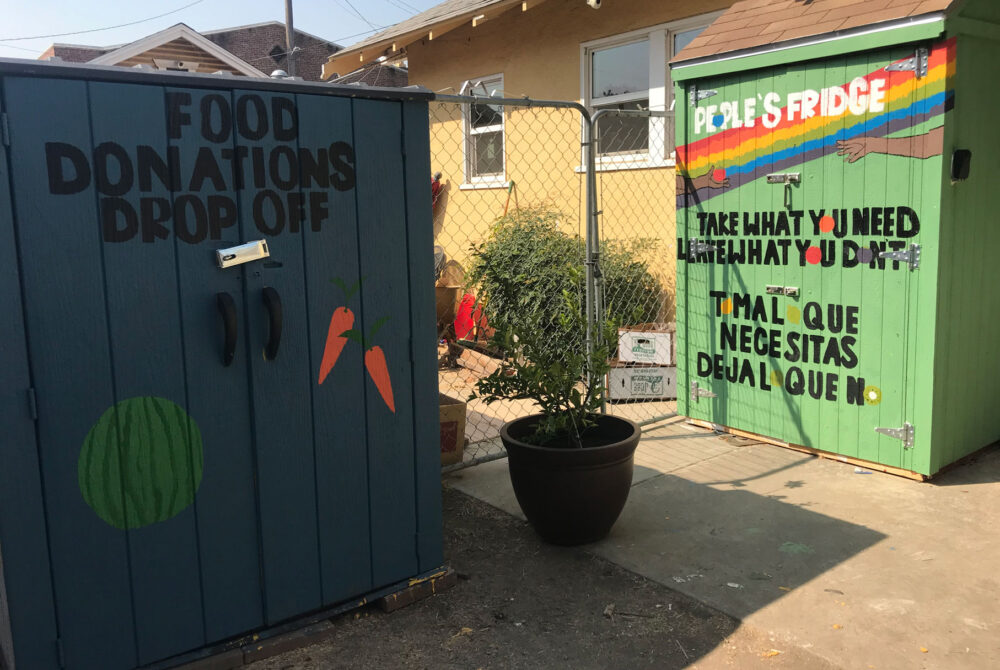
FOOD
UC Merced Dining Centers switched from dine-in only to dine-out only in response to COVID-19.
Green building
The campus certified nine more LEED Platinum buildings.
19 Platinum, 10 Gold and 2 Silver
Total number of LEED certifications
procurement
At the time of this report, sustainable procurement data was not yet available for fiscal year 2020–21. Fiscal year 2019–20 data is available in the 2020 Annual Sustainability Report.
Sustainable Building & Laboratory Operations
total assessed research labs
There was no new activity in the fiscal year due to COVID-19. However, the campus was able to complete a Green Lab Guide that advises researchers and design teams on how to develop a sustainable lab.
Transportation
UC Merced continued to make strides in its efforts to use alternative transportation methods and support the use of electric vehicles in 2021.

of light-duty vehicles acquired in 2021 were electric (zero-emission) or hybrid vehicles

EV charging stations at this location for 2020-2021
water
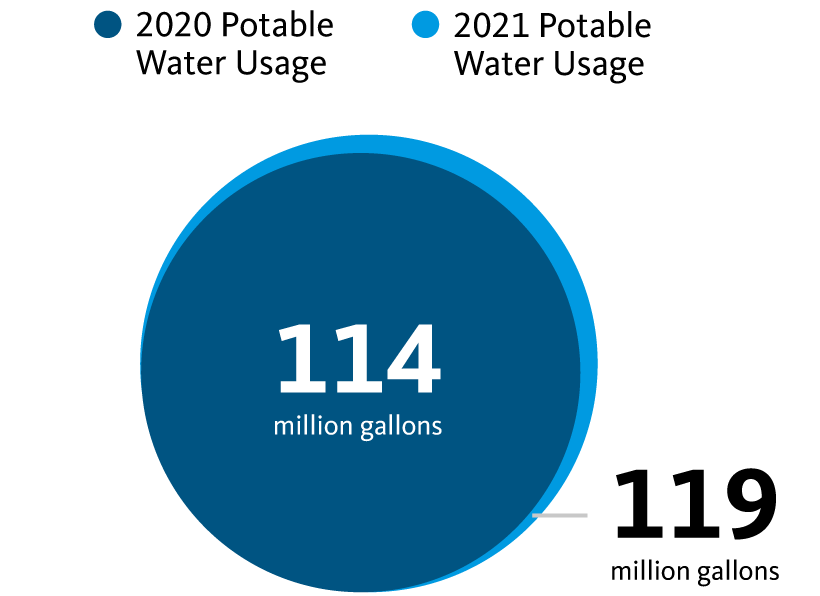
While UC Merced is on track to meet the 2025 goal of 36% reduction of water, the campus’s overall water use increased in fiscal year 2020–21 compared to the previous year, a result of adding nine new buildings and several commissioning operations, such as building water flush-outs, that consumed a considerable amount of water. This year’s report illustrates the difference in water consumption between fiscal year 2019–20 and fiscal year 2020–21 instead of measuring progress toward the 2025 goal.
ZERO WASTE – GENERATion
Due to COVID-19, there was a major reduction in compost and food rescue on campus. With the campus closure and concerns for safety, the food recovery program on campus shut down temporarily. From March to September 2020, the campus recycling center was also closed. During this time, trash from upper campus was not sorted and instead thrown into landfill, increasing the campus landfill numbers tremendously.
ZERO WASTE – DIVERsion
UC Merced’s diversion was lower in fiscal year 2020–21 compared to the previous year due to low amounts of compost and recycling and the high amount of landfill.
Awards
UC Merced was the proud recipient of several sustainability awards in 2020.
UC Merced is ranked in The Princeton Review Top 50 Green Colleges.
A full list of awards is featured on the UC Office of the President’s website.