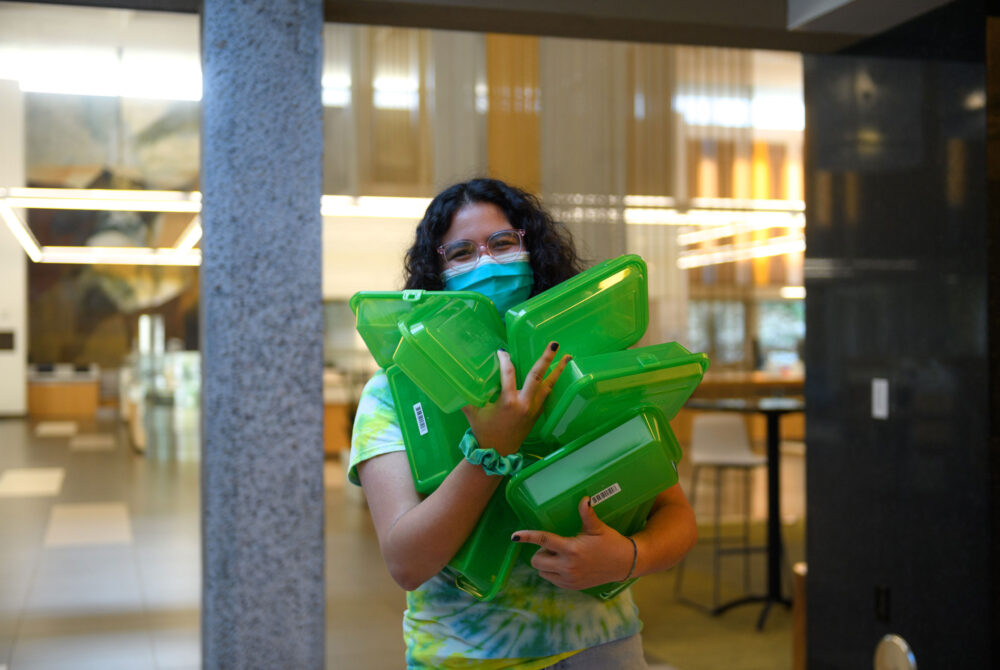
In an ongoing effort to reduce campus waste, Housing, Dining and Hospitality introduced the Triton2Go reusable container program, replacing nearly 300,000 disposable containers since fall quarter 2020. UC San Diego received the City of San Diego 2020 Recycler of the Year Award for improving its waste diversion rate.
Campus utilities technicians installed over 250 utility meters that automatically detect leaks and warn staff who can address issues quickly, saving water and reducing maintenance costs. Total campus water consumption decreased by 14% compared to the previous year with major reductions in all areas, including a 20% reduction in industrial water used at campus utility plants. Additionally, overall energy consumption decreased by around 8%.
UC San Diego continues to leverage public funding to expand the campus electric vehicle charging infrastructure with 300 ports that serve commuters and the public. The campus is San Diego County’s largest multipurpose hub of EV charging plazas, delivering 2.5 gigawatt hours to more than 5,500 unique drivers. SANDAG recognized UC San Diego for excellence in promoting alternative commuting choices. Logistics added a second truck and a van to its electric delivery fleet.
The Sustainability Programs Office launched the Green Classroom Certification Program to help campus educators promote resource conservation and receive recognition for their leadership in sustainability. The office also encouraged graduating seniors to sign a pledge promising to consider the consequences of their workplace decisions to create a sustainable society.
Stories
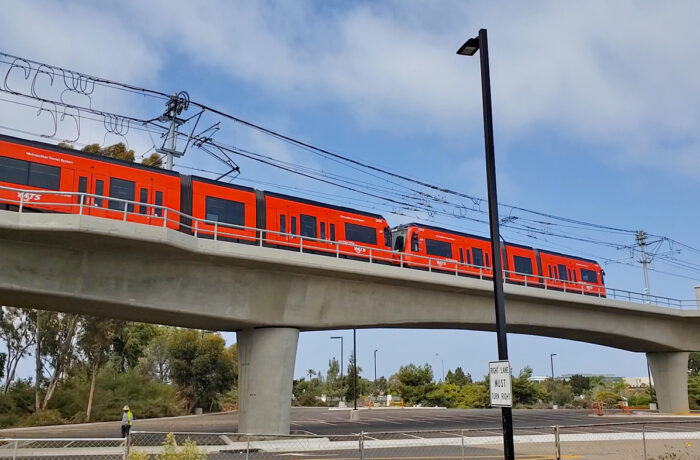

San Diego Mid-Coast Trolley Reaches Final Stretch
UC San Diego supports state and local transportation projects that will improve mobility on and around the campus and make it more accessible to community members across the county.
County Partners with UC San Diego on Plan to Reach Zero Emissions by 2035
UC San Diego School of Global Policy and Strategy will work together with the County of San Diego to draft a blueprint for a regional zero-carbon sustainability plan.
CLIMATE PROTECTION – EMISSIONS
In 2020, UC San Diego decreased its total greenhouse gas emissions by 36%, or over 94,000 metric tons of CO2e, from 2019. This reduction equates to the amount of greenhouse gas emissions from about 19,000 passenger vehicles driven for one year. This decline was a result of increased remote work and restrictions on travel due to COVID-19 as well as 100% clean power provided by UC’s Clean Power Program. (At the time of data collection, campus greenhouse gas emissions were not yet third-party verified. Updates will be made, as needed, in future reports.)
ENERGY – RENEWABLE ELECTRICITY GENERATION
ENERGY USE INTENSITY (EUI)
UC San Diego saw a decrease in its EUI in the calendar year 2020; this also includes UC San Diego Health’s EUI data.
FOOD
In fiscal year 2020–21, an estimated 18% of UC San Diego’s total food and beverage spend met sustainability criteria, a decrease from the previous year. COVID-19 had negative impacts on the on-campus student population and dining operations, and most dining establishments remained closed or operational at limited capacity. Data collection from vendors was also incomplete.
Green building
UC San Diego received three new LEED green building certifications in fiscal year 2020–21.
4 Platinum, 27 Gold, 14 Silver and 3 Certified
Total number of LEED certifications
procurement
At the time of this report, sustainable procurement data was not yet available for fiscal year 2020–21. Fiscal year 2019–20 data is available in the 2020 Annual Sustainability Report.
Sustainable Building & Laboratory Operations
total assessed research labs
In fiscal year 2020–21, the number of certified Green Labs at UC San Diego rose from 96 to 103 in total. Restrictions related to COVID-19 limited further certification efforts.
Transportation
In fiscal year 2020–21, UC San Diego’s alternative transportation rate nearly doubled, from 42% the previous year to 83%, as a result of approximately 80% of staff working remotely due to COVID-19. UC San Diego procured 48 new light-duty fleet vehicles, with 33% of those vehicles considered sustainable.
of UC San Diego students and employees, including those at UC San Diego Health, are utilizing alternative commuting methods

EV charging stations at this location for 2020-2021, including the UC San Diego Health System
of light-duty vehicles acquired at UC San Diego and UC San Diego Health in 2021 were electric (zero-emission) or hybrid vehicles
WATEr
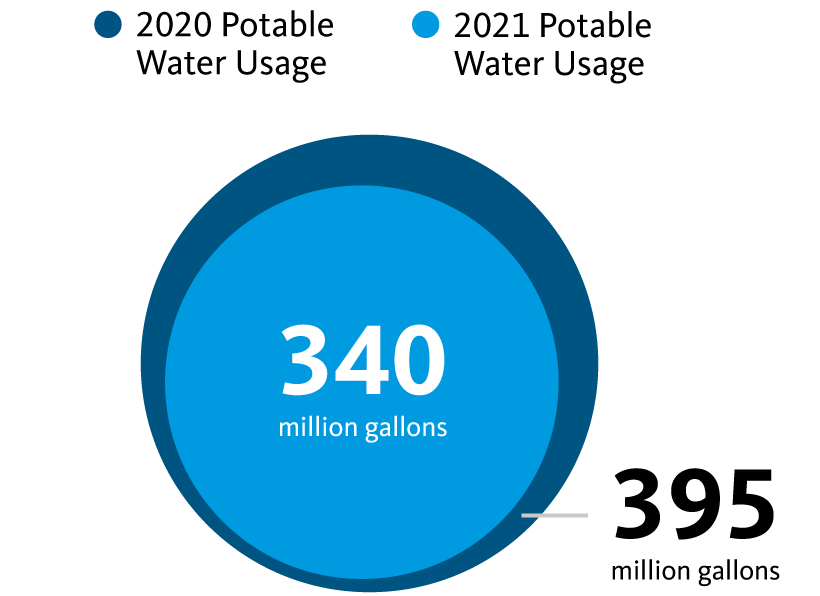
UC San Diego’s potable water use decreased by 14% from the previous fiscal year. This equates to a reduction of 54,955,560 gallons, or enough to fill approximately 83 Olympic-sized swimming pools. This decrease in overall water consumption was a result of increased remote work and reduced residential occupancy. This year’s report illustrates the difference in water consumption between fiscal year 2019–20 and fiscal year 2020–21 instead of measuring progress toward the 2025 goal. This data also includes water use from UC San Diego Health.
ZERO WASTE – GENERATion
UC San Diego saw an increase in its waste generation on a per capita basis.
ZERO WASTE – DIVERsion
UC San Diego’s overall waste generation decreased by 1,391 tons in fiscal year 2020–21, compared to the previous year, while the campus also increased its waste diversion rate by 8%. This decrease in overall waste diversion was a result of increased remote work and reduced residential occupancy.
Awards
UC San Diego was the proud recipient of an AASHE STARS Gold rating in 2021.
A full list of awards is featured on the UC Office of the President’s website.