This past year, Berkeley remained focused on marking progress and emerging from the pandemic with plans for a more sustainable and inclusive campus.
Motivated to find solutions to drought and enable green building, Berkeley developed a comprehensive water resilience plan identifying the opportunity for an on-site wastewater treatment plant to provide up to 30% of the campus water. On-site solar installations are now underway, adding 3.6 megawatts of renewable power with batteries and a microgrid for resiliency. Additionally, Berkeley launched the Clean Energy Campus initiative, kickstarting an intensive decarbonization plan to electrify the campus.
In its 2021 Sustainability Tracking, Assessment and Rating System (STARS) submission, UC Berkeley earned a Platinum rating, securing the seventh spot out of 674 universities. STARS revealed a host of accomplishments, including 50% of Berkeley’s courses having a sustainability focus and 95% of the landscape being organically managed. In its 17th year, the Chancellor’s Advisory Committee on Sustainability honored six graduating seniors as changemakers in ending plastic pollution, creating plant-forward menus and notably for advancing environmental justice. Student leaders were recognized by the city’s mayor with a proclamation for spurring 2,500 community members to take donated furniture home and diverting 200,000 pounds of waste during the Cal Move Out event.
While on-campus activities and population were limited, Berkeley’s essential workers sustainably supported campus buildings, labs, and dining and residence halls that mostly remained operational. Energy use was only slightly reduced during the year as a result, but carbon emissions from the commute, air travel, water use and waste were reduced.
Stories
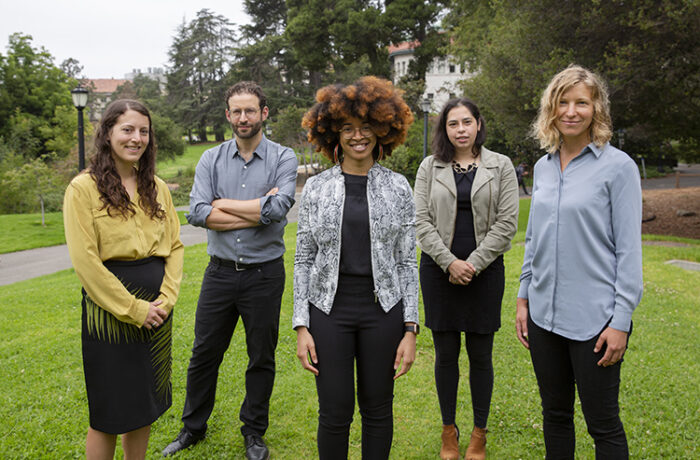

New Faculty, Hired in Clusters, to Address Global Issues, Equity Justice
Five new faculty members at UC Berkeley this fall hail from disparate U.S. states, academic disciplines and personal backgrounds. But they’re already forming a team partnered around one critical global issue — climate equity and environmental justice — as part of six interdisciplinary faculty “cluster hires” underway on campus.
In Calculating the Social Cost of Methane, Equity Matters
What is the cost of one ton of a greenhouse gas? When a climate-warming gas such as carbon dioxide or methane is emitted into the atmosphere, its impacts may be felt years and even decades into the future — in the form of rising sea levels, changes in agricultural productivity or more extreme weather events, […]
CLIMATE PROTECTION – EMISSIONS
UC Berkeley has met the 2020 goal for over a decade without the use of offsets. UC Berkeley’s scopes 1, 2 and 3 greenhouse emissions decreased in 2021, with scope 1 emissions decreasing 6% compared to 2019, scope 2 emissions decreasing by 15% and scope 3 emissions decreasing by 51% compared to 2019. Scope 1 emissions did not decrease by much due to COVID-19, as the on-site cogeneration plant ran at capacity. The decrease in scope 3 emissions reflects the impact of the COVID-19 pandemic on campus, including travel restrictions, which greatly reduced business air travel and commuting.
ENERGY – RENEWABLE ELECTRICITY GENERATION
ENERGY USE INTENSITY (EUI)
UC Berkeley saw a decrease in its EUI in the calendar year 2020.
FOOD
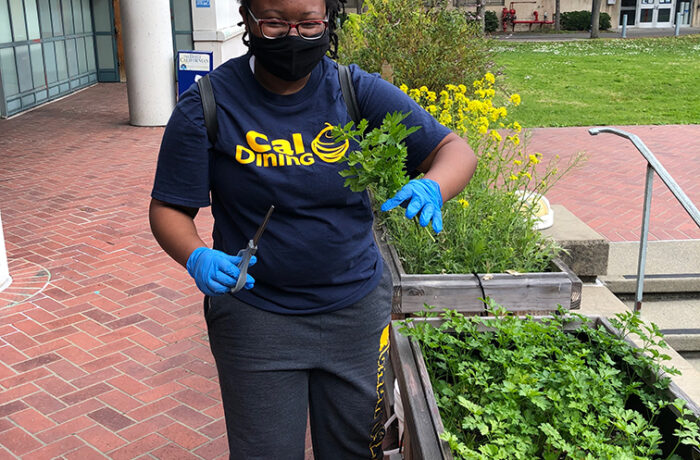
The pandemic created challenges that affected UC Berkeley’s ability to increase sustainable food sourcing. UC Berkeley purchased about a third of the food and beverages that the campus has in the past. However, by promoting plant-forward menus, the campus saw an increase in plant-based ingredients.
Green building
UC Berkeley added one LEED Gold and one LEED Silver Certification.
2 Platinum, 13 Gold, 8 Silver and 1 Certified
Total number of LEED certifications
procurement
At the time of this report, sustainable procurement data was not yet available for fiscal year 2020–21. Fiscal year 2019–20 data is available in the 2020 Annual Sustainability Report.
Sustainable Building & Laboratory Operations
total assessed research labs
Due to the pandemic, work on the campus Green Labs action plan and lab certifications were delayed; data reported for fiscal year 2020-21 is the same as the previous year.
Transportation
During the pandemic, due to the reduced population on the campus, there was little usage of parking facilities and demand for parking by individuals (the telecommute rate was in the 80% range). Planning for the return of more students and staff, the campus installed new electric vehicle chargers in the Recreation Sports Facility garage.

of UCB students and employees are utilizing alternative commuting methods

EV charging stations at this location for 2021-2022

of light-duty vehicles acquired in 2021 were electric (zero-emission) or hybrid vehicles
WATER
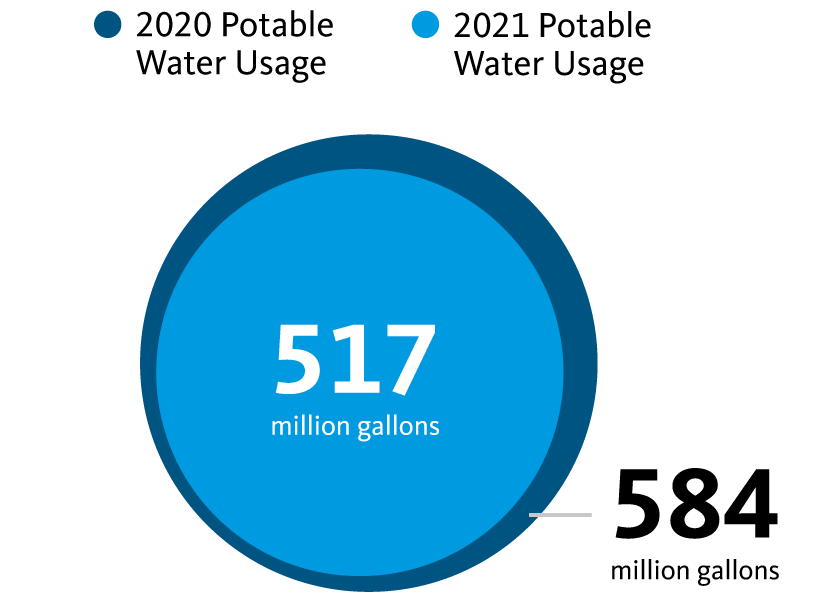
UC Berkeley’s 12% drop in gallons of water in 2020 compared to 2019 reflects the reduction in domestic and lab-related water use resulting from the suspension of all in-person classes and limited on-campus staffing for the duration of the calendar year. This year’s report illustrates the difference in water consumption between fiscal year 2019–20 and fiscal year 2020–21 instead of measuring progress toward the 2025 goal.
ZERO WASTE – GENERATION
Due to the pandemic, landfill, compost and recyclables from campus buildings and events decreased. The campus did see an increase in landfill waste generated outdoors due to community use of the outdoor areas and to-go foodware.
ZERO WASTE – DIVERsion
UC Berkeley adopted a Single-Use Elimination Policy to ban all nonessential single-use plastics with viable alternatives by 2030. A draft Single Use Plastics Elimination Roadmap was also completed in 2020. COVID-19 closures offered an opportunity to complete distribution of landfill, recycling and composting bins in all campus buildings and grounds. Despite the drop in materials being used and disposed of, the diversion rate did not change between fiscal year 2020–21 and the previous year.
Awards
UC Berkeley was the proud recipient of several sustainability awards in 2021.
UC Berkeley is ranked in The Princeton Review Top 50 Green Colleges.
A full list of awards is featured on the UC Office of the President’s website.