The success of UC Santa Barbara’s sustainability program was a result of the many on- and off-campus community partnerships that help inform and energize its work. UC Santa Barbara strives to integrate concepts of sustainability and climate justice into education, research and action. UC Santa Barbara has also invested new resources into creating a representative and inclusive program.
Last year Transportation and Parking Services and the Associated Students Bike Committee began a series of sustainable transportation improvements, including adding more electric vehicle charging stations, installing parking occupancy systems, and improving bike paths and bike parking. Eighty-nine charging stations are now available for use to the campus community, up from the 23 that were available two years prior.
In 2020, UC Santa Barbara’s total operational greenhouse gas emissions were about 50% below 1990 levels, despite a near doubling in square footage. In July 2020, UC Santa Barbara joined the UC Clean Power Program, and the main campus is now powered by carbon-free electricity, dropping the campus’s operational greenhouse gas emissions by 50%.
UC Santa Barbara also has a new innovative academic program geared specifically toward undergraduates. Started by Simone Pulver, an assistant professor of environmental studies, the Environmental Leadership Incubator (ELI) is a nine-month program that trains students to become environmental leaders. The ELI program is organized around student-initiated projects that seek to implement positive environmental change.
CLIMATE PROTECTION – EMISSIONS
UC Santa Barbara’s scopes 1 and 2 emissions in 2020 were 63% of the emissions in the prior year due to pandemic closures. Scope 3 emissions were 30% of the prior year due to increased telecommuting. (At the time of data collection, campus greenhouse gas emissions were not yet third-party verified. Updates will be made, as needed, in future reports.)
ENERGY – RENEWABLE ELECTRICITY GENERATION
ENERGY USE INTENSITY (EUI)
UC Santa Barbara saw a decrease in its EUI in the calendar year 2020.
FOOD
UC Santa Barbara’s overall spend on both food and beverages, as well as sustainable food and beverages, decreased in fiscal year 2020–21. Only two food service operations remained open, with limited hours.
Green building
UC Santa Barbara did not add any new LEED green building certifications in fiscal year 2020–21.
14 Platinum, 40 Gold, 15 Silver and 2 Certified
Total number of LEED certifications
procurement
At the time of this report, sustainable procurement data was not yet available for fiscal year 2020–21. Fiscal year 2019–20 data is available in the 2020 Annual Sustainability Report.
Sustainable Building & Laboratory Operations
total assessed research labs
UC Santa Barbara’s lab assessment program, LabRATS, did not have access to campus labs in fiscal year 2020–21 due to COVID-19. The campus did offer an online training module on sustainable lab operations and collaborated with procurement on several efforts.
Transportation
UC Santa Barbara has not done a transportation and mode split survey since the pandemic began. Its last survey was in 2019. Most students, staff and faculty (about 90%) worked and studied remotely over fiscal year 2020–21. The campus weighted users were only 7% of what they were in fiscal year 2019–20.

EV charging stations at this location for 2020-2021

of light-duty vehicles acquired in 2021 were electric (zero-emission) or hybrid vehicles
water
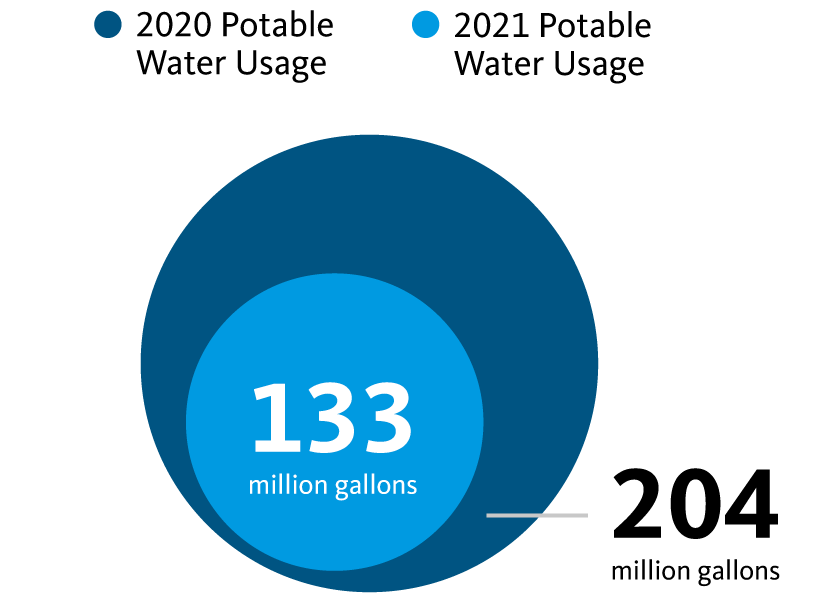
UC Santa Barbara’s potable water consumption decreased from fiscal year 2019–20 to fiscal year 2020–21. The campus’s use of recycled water increased, mainly for landscaping. This year’s report illustrates the difference in water consumption between fiscal year 2019–20 and fiscal year 2020–21 instead of measuring progress toward the 2025 goal.
ZERO WASTE – GENERATion
Due to COVID-19, there was a significant reduction in waste on campus from fiscal year 2019–20 to fiscal year 2020–21.
ZERO WASTE – DIVERsion
UC Santa Barbara’s waste diversion rate increased by 4% in fiscal year 2020–21 compared to the previous year.
Awards
UC Santa Barbara is ranked in The Princeton Review Top 50 Green Colleges.
A full list of awards is featured on the UC Office of the President’s website.