Despite remote instruction and a full campus evacuation due to the CZU fire, UC Santa Cruz still has many sustainable accomplishments to report. With decreased personnel on campus, there was an almost 40% reduction in total greenhouse gas emissions and a 34% reduction in potable water use from the previous year.
UC Santa Cruz launched a new agroecology major, which focuses on the ecology of agricultural systems with the goal of designing farming methods that conserve resources, maintain yields and protect the health of people and surrounding natural landscapes.
The Sustainability Office adjusted conservation programs to accommodate remote engagement through programs like the “stay green during quarantine” Home Office Assessment and by launching a new environmental and social justice film series.
UC Santa Cruz’s employee educational certificate classes went virtual and set record graduation rates. The Sustainability Certificate Program had 36 graduates for a total of 114 since 2018.
While the campus’s student population was significantly reduced, operational staff stayed hard at work implementing sustainable infrastructure. Over $1 million in grant money enabled the campus to upgrade the Great Meadow Bike Path by improving the pavement and widening the path for mixed pedestrian use. The Grounds Services department took a holistic approach to improving the biome of the athletic fields, which resulted in saving approximately 1 million gallons of water. Lastly, UC Santa Cruz achieved Fair Trade University status thanks to the efforts of students, and also adopted the DocuSign electronic signature platform, saving tens of thousands of pounds of paper campuswide.

Stories

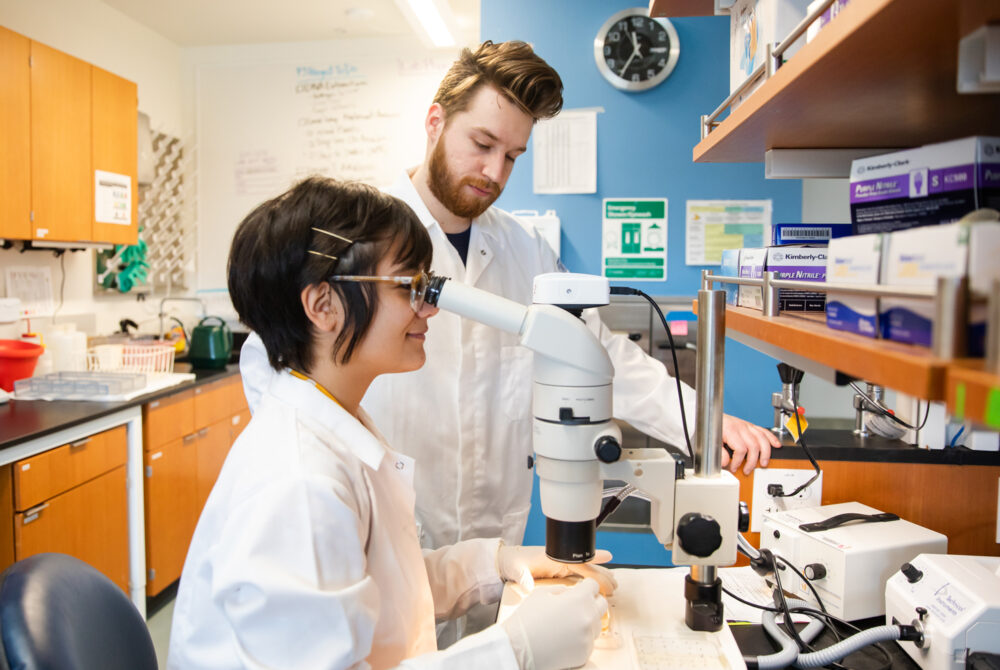
UC Santa Cruz’s Global Environmental Justice Observatory Launches Peer-Reviewed, Student-Edited Journal of Global Environmental Justice
UCSC’s new student-edited, peer-reviewed Journal of Global Environmental Justice supports research and education in the interface of the environment and climate change, social justice and human rights.
CLIMATE PROTECTION – EMISSIONS
In 2021, UC Santa Cruz did a deep dive into historic emissions reporting. As a result, small updates to historic emissions were made in 2020. Due to COVID-19, emissions were lower. (At the time of data collection, campus greenhouse gas emissions were not yet third-party verified. Updates will be made, as needed, in future reports.)
ENERGY – RENEWABLE ELECTRICITY GENERATION
ENERGY USE INTENSITY (EUI)
UC Santa Cruz saw a decrease in its EUI in the calendar year 2020.
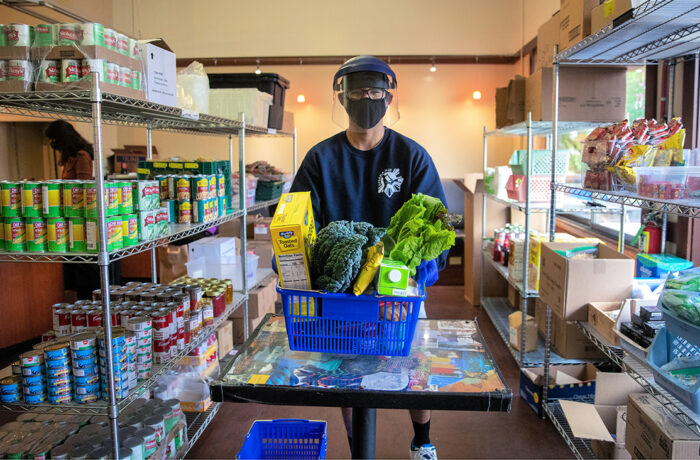
FOOD
Due to COVID-19, food consumption was down significantly in fiscal year 2020–21.
Green building
Although the new Environmental Health and Safety Facility was constructed in 2020, UC Santa Cruz was still waiting for the U.S. Green Building Council to approve three LEED outstanding credits at the time of this report.
7 Gold, 6 Silver and 2 Certified
Total number of LEED certifications
procurement
At the time of this report, sustainable procurement data was not yet available for fiscal year 2020–21. Fiscal year 2019–20 data is available in the 2020 Annual Sustainability Report.
Sustainable Building & Laboratory Operations
total assessed research labs
Due to COVID-19, no labs were certified in fiscal year 2020–21.
Transportation
Due to COVID-19, there was a significant decrease in commuting. The reported alternative commute rate was based on trips made to the campus and did not include the 67% of the population working or learning from home.

of UCSC students and employees are utilizing alternative commuting methods

EV charging stations at this location for 2020-2021

of light-duty vehicles acquired in 2021 were electric (zero-emission) or hybrid vehicles
Water
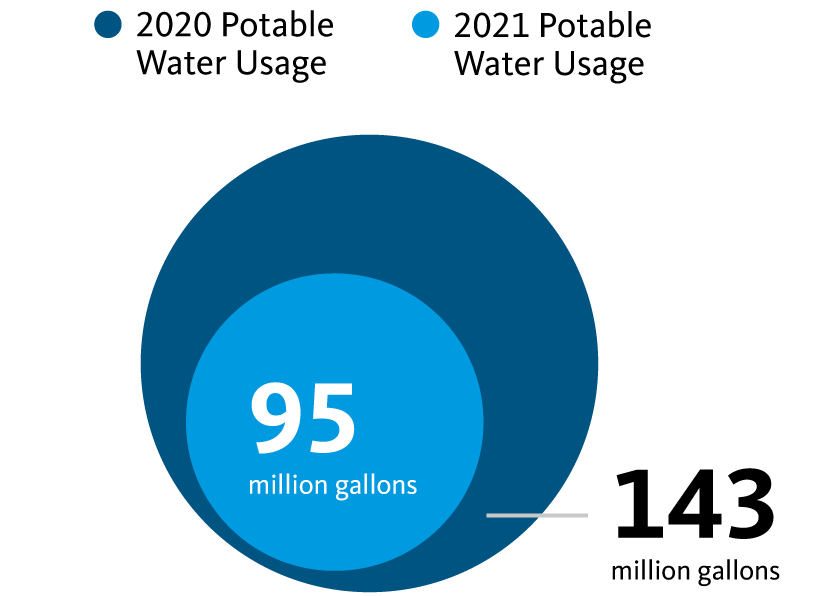
The vast majority of water savings in fiscal year 2020–21 should be attributed to a lower campus population. That being said, departments across campus were cognizant of the growing water crisis and implemented conservation measures. For example, the Grounds department saved 1 million gallons of water through improved soil management. This year’s report illustrates the difference in water consumption between fiscal year 2019–20 and fiscal year 2020–21 instead of measuring progress toward the 2025 goal.
ZERO WASTE – GENERATion
Due to COVID-19, there was a significant reduction in waste on campus.
ZERO WASTE – DIVERsion
UC Santa Cruz changed the handling of recyclables to a more inclusive operator that accepts paper and cardboard in the recycling stream, which resulted in more waste diversion.
Awards
UC Santa Cruz is ranked in The Princeton Review Top 50 Green Colleges.
A full list of awards is featured on the UC Office of the President’s website.