In 2021, UC Riverside was able to achieve a Gold Rating in the Association for the Advancement of Sustainability in Higher Educations (AASHE) Sustainability Tracking and Reporting System (STARS).This achievement was in recognition of the campus-wide efforts to incorporate sustainability in academics, engagement, operations and public administration.
Academically, the campus worked to offer the Bending the Curve climate solutions course concurrently to undergraduates and graduate students along with opening the course to the public for the first time through UC Extension. This course empowered over 70 students to take on major climate change issues and champion climate solutions.
Campus engagement moved completely to remote methods and found success in the Climate Action Leadership Series, a partnership between Student Life and the Office of Sustainability. This program introduced students to local climate issues and the interconnectedness of climate impacts and included discussions on climate solutions.
The COVID-19 pandemic resulted in major impacts to campus operations at UC Riverside. The campus saw a reduction of on-campus populations of approximately 84%. The largest reductions in greenhouse emissions were seen in commuting and flights (scope 3 emissions) of approximately 87.8% and 79.7%, respectively. Due to the continuity of critical research functions, many buildings remained operational throughout the pandemic and thus emissions related to scopes 1 and 2 were not reduced proportionately with the on-campus population. Natural gas emissions (scope 1) dropped 7.8%, and emissions associated with electricity (scope 2) saw a reduction of 14.5%.

Stories
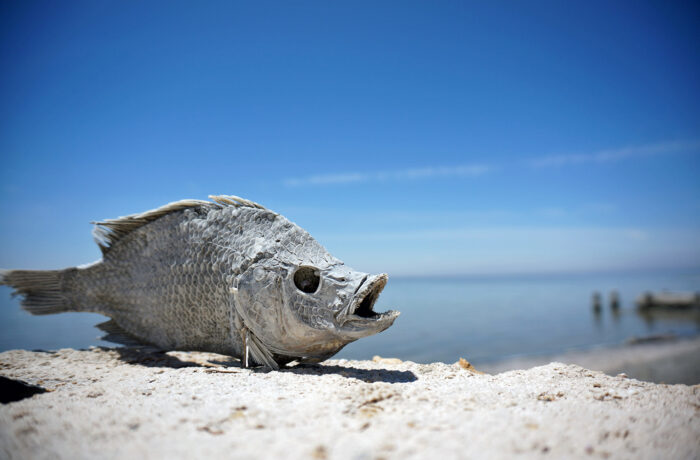

The Salton Sea Presents a Critical Climate Justice Issue in the Riverside Region With Environmental Concerns Intersecting With Those Related to Public Health
UC Riverside researchers from a variety of disciplines — including medicine, the environment and politics — have continued their focus on these issues at the Salton Sea, the inland body of water straddling Riverside and Imperial counties.
CLIMATE PROTECTION – EMISSIONS
In 2020, UC Riverside’s greenhouse gas emissions were reduced by 28%. This amount is equivalent to 5,597 passenger vehicles driven for one year. The major factors in the decline were a reduction in the use of natural gas at the central plant (8%), a reduction in electricity use (9%) and a cleaner supply of electricity from the campus provider, Riverside Public Utilities (6%). Lastly, commute and flight emissions saw a combined drop of 87% due to remote work and flight restrictions. (At the time of data collection, campus greenhouse gas emissions were not yet third-party verified. Updates will be made, as needed, in future reports.)
ENERGY – RENEWABLE ELECTRICITY GENERATION
ENERGY USE INTENSITY (EUI)
UC Riverside saw a decrease in its EUI in the calendar year 2020.
FOOD
The COVID-19 pandemic reduced the number of patrons with meal plans living on campus by approximately 80%, which led to reduced food purchases. The social distancing restrictions set in place eliminated dine-in service and allowed for take-out only, which in turn led to limited menus. Additionally, the pandemic impacted the supply chain with product shortages, forcing substitutions of food products and supplies, which caused a reduction in the percentage of spend on sustainable food products from the prior year.
Green building
The 2020–21 fiscal year was a busy one for new construction projects at UC Riverside. The projects are all awaiting LEED certification, which will likely take place in the coming year.
1 Platinum, 6 Gold, 1 Silver and 1 Certified
Total number of LEED Certifications
procurement
At the time of this report, sustainable procurement data was not yet available for fiscal year 2020–21. Fiscal year 2019–20 data is available in the 2020 Annual Sustainability Report.
Sustainable Building & Laboratory Operations
total assessed research labs
With the COVID-19 restrictions in place at UC Riverside, the campus decided to put the Green Labs program on hold. This was for health and safety reasons, along with a sensitivity to the researchers’ limited time and constraints to conduct their vital work.
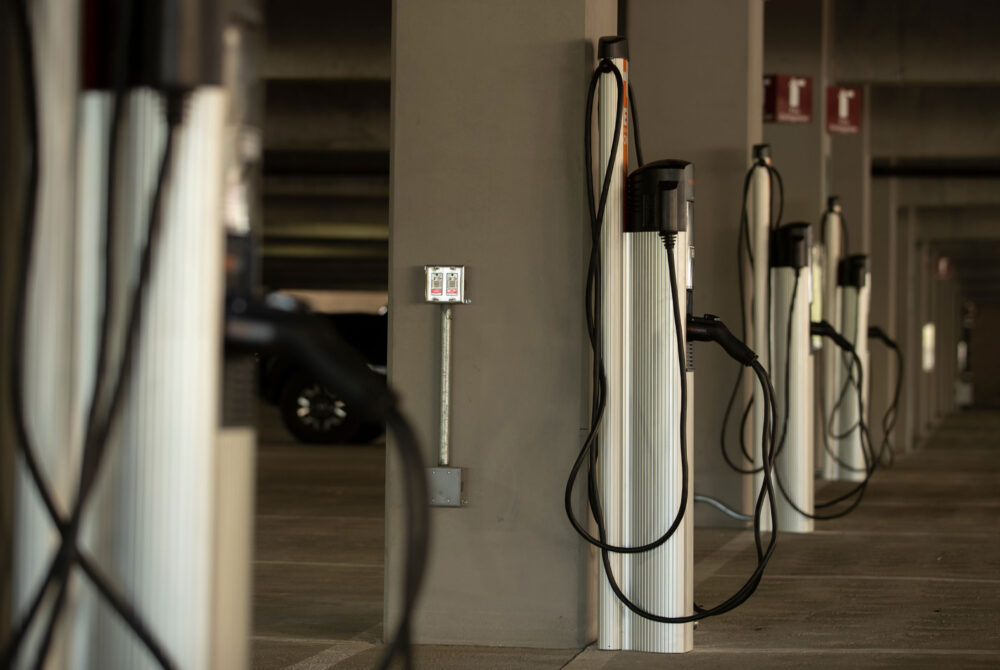
Transportation
UC Riverside saw an 87% reduction in the commute and flight emissions due to the COVID-19 restrictions and the move to remote working conditions. According to campus commute surveys, approximately 72% of the campus population was working remotely in 2020. The campus has now set goals for staff to continue working remotely as the campus reopens publicly. Additionally, UC Riverside received the Bronze Designation from the League of American Bicyclists’ Bicycle Friendly University program for campuswide efforts in increasing alternative commuting methods, including bicycling.

of UCR employees are utilizing alternative commuting methods

EV charging stations at this location for 2020-2021

of light-duty vehicles acquired in 2021 were electric (zero-emission) or hybrid vehicles
WATER
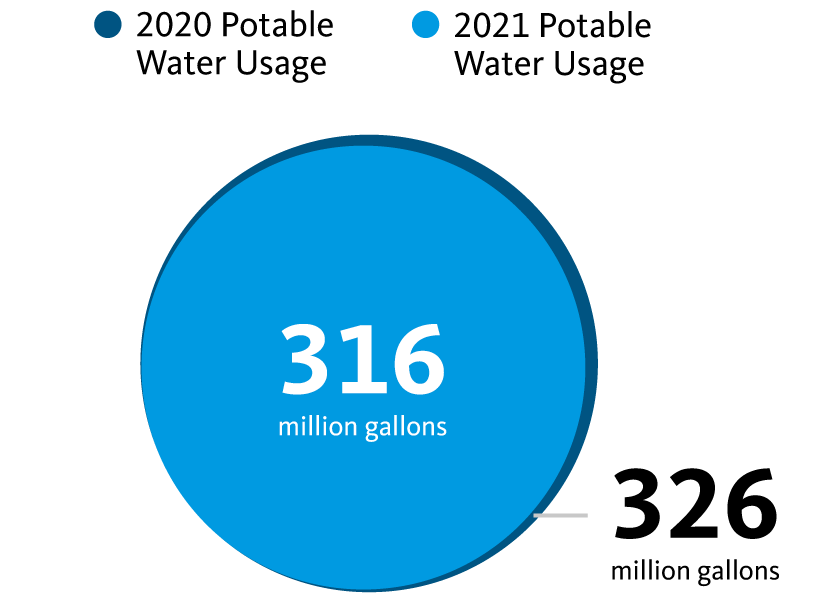
UC Riverside saw a reduction of potable water use in fiscal year 2020–21 of close to 3 percentage points from the previous year. Higher than usual temperatures meant that campus landscaping water needs remained high as well. This year’s report illustrates the difference in water consumption between fiscal year 2019–20 and fiscal year 2020–21 instead of measuring progress toward the 2025 goal.
ZERO WASTE – GENERATion
UC Riverside’s total waste generation was down 43% because of reductions in campus populations of 84% due to campus closure. Many labs continued critical research throughout the pandemic, and many essential staff continued working on campus. Campus apartments did not experience as much of a reduction as many residents continued to live on campus.
ZERO WASTE – DIVERsion
UC Riverside was able to divert 53% of municipal solid waste from landfills, an 18% decrease from the previous year. The pandemic affected the contracted Material Recovery Facilities ability to sort waste due to physical distancing measures, resulting in a lower diversion rate for fiscal year 2020–21. Construction and demolition diversion rates remained high, at 97% of total waste being recycled.
Awards
UC Riverside was the proud recipient of an AASHE STARS Gold rating in 2020.
UC Riverside is ranked in The Princeton Review Top 50 Green Colleges.
A full list of awards is featured on the UC Office of the President’s website.