The UC Office of the President (UCOP) is the systemwide headquarters of the University of California that manages UC’s fiscal and business operations and supports the academic and research missions across its campuses, labs and health systems. UCOP owns and leases space primarily in California, but also has properties in Washington, D.C., and Mexico City.
In fiscal year 2020–21, UCOP completed a major office consolidation project in downtown Oakland. The consolidation, combined with reduced building occupancy due to COVID-19, led to a drop in scopes 1 and 2 greenhouse gas emissions by 37% and a reduction in potable water use by 64% compared to the previous fiscal year. Notably, UCOP’s headquarters, 1111 Franklin, saw a 63% decrease in natural gas CO2 emissions compared to 2019, due in part to energy efficiency measures related to building heating, ventilation and air conditioning.
Stories

JEDI-Centered Climate Resilience Planning and Stakeholder Engagement
UCOP’s sustainability team partnered with an equity consultant and campus stakeholders to develop guidance for climate resilience planning at campuses and health systems that centers justice, equity, diversity and inclusion (JEDI).
CLIMATE PROTECTION – EMISSIONS
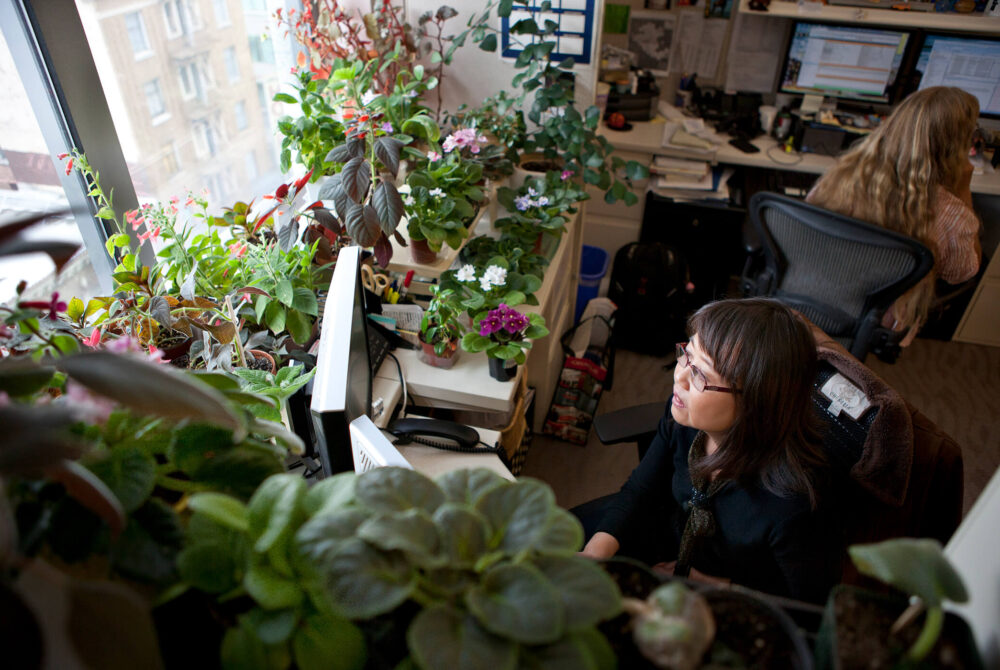
UCOP’s overall energy use decreased in 2020, mostly as a result of its workforce working remotely.
ENERGY – RENEWABLE ELECTRICITY GENERATION
ENERGY USE INTENSITY (EUI)
UCOP saw a decrease in its EUI in the calendar year 2020.
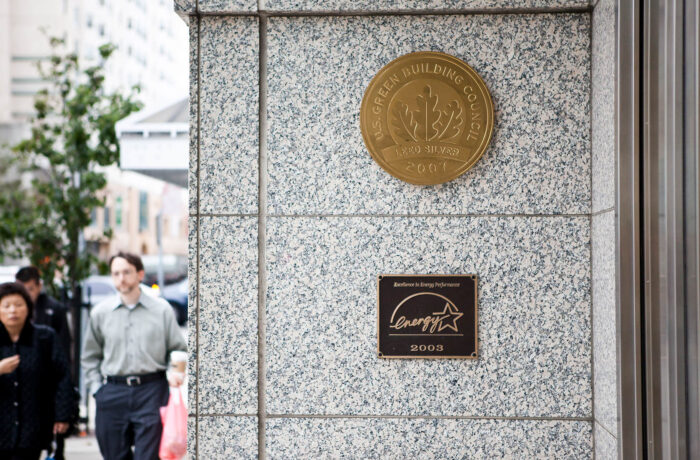
Green building
UCOP did not add any new LEED certifications in 2021.
1 Platinum, 1 Gold and 2 Silver
Total number of LEED certifications
procurement
At the time of this report, sustainable procurement data was not yet available for fiscal year 2020–21. Fiscal year 2019–20 data is available in the 2020 Annual Sustainability Report.
Transportation
The Office of the President continued to make strides in its efforts to use alternative transportation methods.

of UCOP employees are utilizing alternative commuting methods

EV charging stations at this location for 2020-2021
water
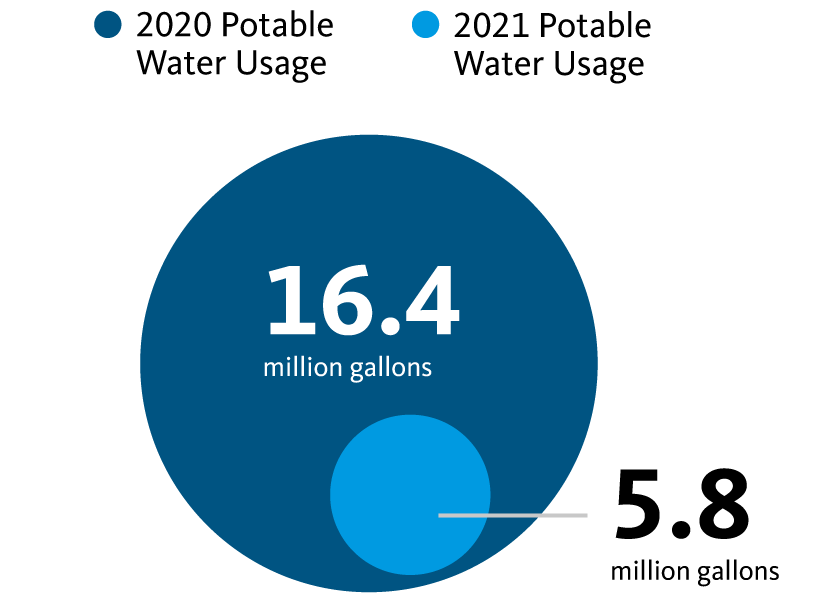
Overall water use decreased for UCOP in fiscal year 2020–21 compared to the year before, mostly as a result of its workforce working remotely. However, the Franklin building had a water leak in winter 2021, and therefore consumption tripled during a two-month period compared to the year before. This year’s report illustrates the difference in water consumption between fiscal year 2019–20 and fiscal year 2020–21 instead of measuring progress toward the 2025 goal.