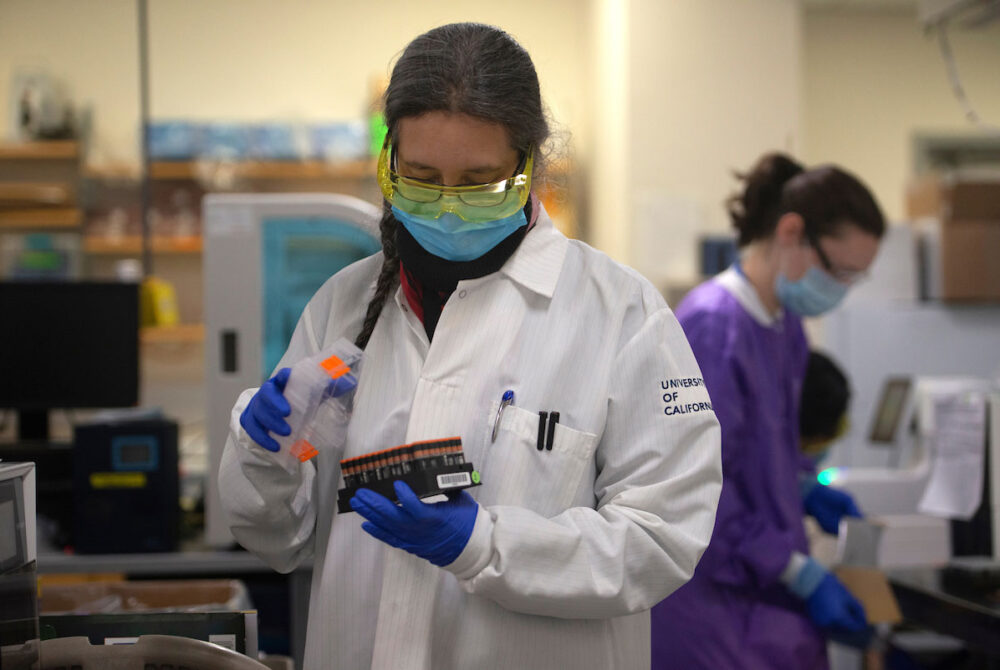
While the pandemic caused a major shift in daily campus operations, UC Davis quickly responded to the new needs of the campus and local community by launching Workplace Reimagined and working with the City of Davis to offer COVID-19 testing and vaccinations with Healthy Davis Together. The Causeway Connection offered free transportation to COVID-19 vaccination appointments.
UC Davis sustainability engagement continued throughout the pandemic with the Green Home Office program, a seminar on student leadership for climate change, a new Sustainability website, awareness-building events for the U.N. Sustainable Development Goals and the inaugural UC Davis Voluntary University Review process. The campus continued taking steps toward sustainability goals by introducing new waste bins (increasing access to composting), adding waste compactors to student housing and dining facilities (reducing solid waste pickups), supporting the cultivation of a resilient urban tree canopy through a student-planted tree trial test site and securing full funding for 14 Unitrans-operated electric buses.
UC Davis saw only modest reductions in energy use, considering that only a third of the regular campus population actively worked and studied on campus. UC Davis’s ongoing programs around lab research and animal and human patient care contributed to steady energy and water use. UC Davis did have a decline in overall waste production and single-occupancy-vehicle commuters due to an increase in telecommuting and a smaller on-campus population. The quieter campus aided the construction work for the Big Shift, a project to replace gas-powered steam heating as part of the campus’s carbon neutrality efforts.
Stories

Decarbonizing California Transportation by 2045
UC Davis transportation and policy experts released a report to the California Environmental Protection Agency evaluating a path to a carbon neutral transportation system for California that connects health, equity and environmental justice benefits.
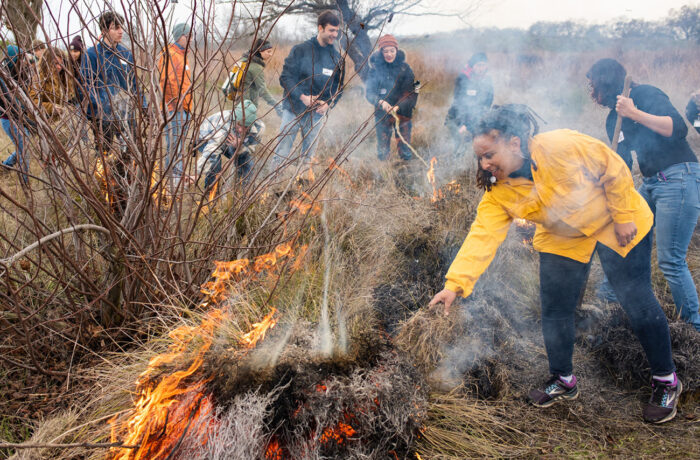
Rethinking Wildfire: Cultural Burning and the Art of Not Fighting Fire
UC Davis students and faculty partnered with regional tribes to participate in cultural burns — a tool used by Native people to renew plants and watersheds — and learn about their connection to climate justice.
CLIMATE PROTECTION – EMISSIONS
The drop in UC Davis’s greenhouse gas emissions from the past year can be attributed to modest declines in energy consumption and more significant drops in commuting and business air travel emissions as a result of the pandemic. (At the time of data collection, campus greenhouse gas emissions were not yet third-party verified. Updates will be made, as needed, in future reports.)
ENERGY – RENEWABLE ELECTRICITY GENERATION
ENERGY USE INTENSITY (EUI)
UC Davis saw a decrease in its EUI in the calendar year 2020.
FOOD
UC Davis’s total food and beverage spend was impacted by COVID-19. Although there was no significant change in fiscal year 2020–21 in the percentage of sustainable food and beverage spend and plant-based spend compared to the previous year, the total food and beverage spend decreased by about $7.5 million, a 67% decrease from the previous year. Student Housing and Dining Services experienced a low resident occupancy and the Associated Students of UC Davis Coffee House fully closed operations from January to September 2021 due to the pandemic.
Green building
In fiscal year 2020–21, UC Davis added three new LEED certified buildings and earned one Gold certification for an existing building, making a total of four LEED certifications this fiscal year.
10 Platinum, 25 Gold, 6 Silver and 1 Certified
Total number of LEED certifications
procurement
At the time of this report, sustainable procurement data was not yet available for fiscal year 2020–21. Fiscal year 2019–20 data is available in the 2020 Annual Sustainability Report.
Sustainable Building & Laboratory Operations
total assessed research labs
UC Davis did not certify any new labs due to the pandemic. The campus will begin assessing Green Labs after the return to in-person work and instruction. Data reported for fiscal year 2020-21 is the same as the previous year.
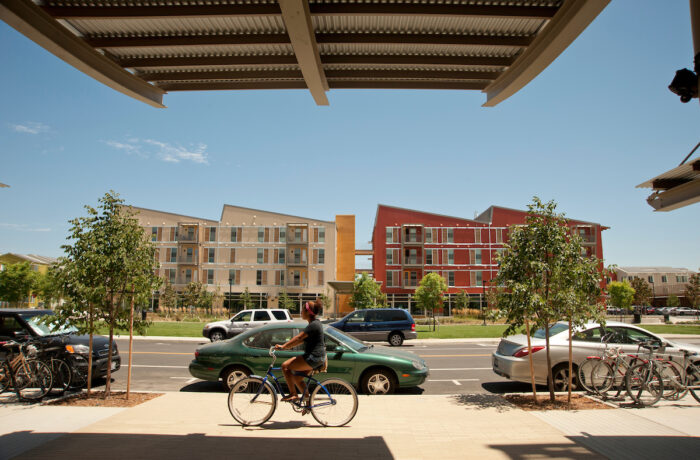
Transportation
UC Davis saw a significant decrease in single-occupancy-vehicle (SOV) commuters from the 2015 baseline: 43% for employees and 37% for all employees and students. This decrease was a result of pandemic-induced telecommuting. Telecommuting at UC Davis increased by 66%, while one-third of the campus population commuted to campus one or more days a week over the past year. The campus is currently meeting the 2050 goal to reduce SOV commutes, but the percent of SOV commuting is expected to rise when campus returns fully to in-person activities.
of UCD students and employees are utilizing alternative commuting methods
EV charging stations at this location for 2020-2021
of light-duty vehicles acquired in 2021 were electric (zero-emission) or hybrid vehicles
WATER
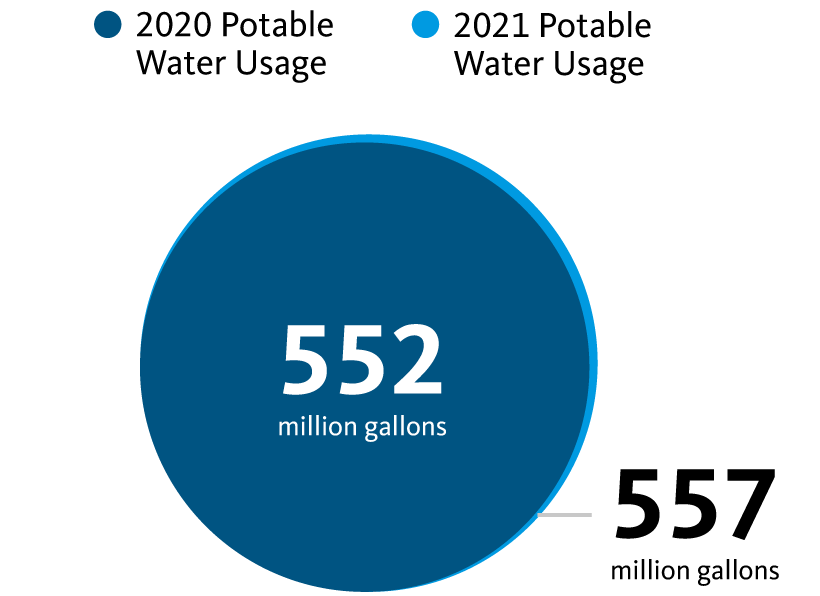
UC Davis’s potable water use increased by 5 million gallons compared to fiscal year 2019–20. Water-intense functions continued despite a lower population on campus. Campus growth and exceptional drought conditions caused additional landscape irrigation demands. This year’s report illustrates the difference in water consumption between fiscal year 2019–20 and fiscal year 2020–21 instead of measuring progress toward the 2025 goal.
ZERO WASTE – GENERATION
Due to the COVID-19 public health orders resulting in a lower population on campus, overall waste generation was lower at UC Davis in the last fiscal year. The campus reduced its overall municipal solid waste generation by over 4,500 tons from fiscal year 2019–20, representing a 23% reduction. This amount of waste could fill up almost three professional football stadiums.
ZERO WASTE – DIVERsion
UC Davis diverted 72% of its waste in fiscal year 2020–21 (excluding construction and demolition), a 4% increase over the previous fiscal year. However, because of the campus closure due to the pandemic, the amount of total waste generated decreased, including a lower volume of diverted waste (a decrease of 2,639 tons, or the equivalent weight of 14 blue whales). Even though the total weight of diverted waste decreased this year from last year, the ratio of diverted waste compared to total waste generated was slightly higher compared to the previous year.
Awards
UC Davis was the proud recipient of several sustainability awards in 2021.
A full list of awards is featured on the UC Office of the President’s website.