Climate
All campuses, including their health systems, achieved the University’s climate policy goal of reducing greenhouse gas emissions to 1990 levels by 2020 (based on reported emissions that will be third-party verified by early 2022). In aggregate, their net greenhouse gas emissions decreased by roughly 24% in 2020 compared to 2019. This included an approximate 7% decrease in scope 1 emissions, 33% decrease in scope 2 emissions and a 56% decrease in scope 3 emissions. Campuses purchased compliance and voluntary offsets that contribute to their emissions reductions. The magnitude of emissions reductions in 2020, especially for scope 3 air travel and commute emissions, reflect the impact of COVID-19.
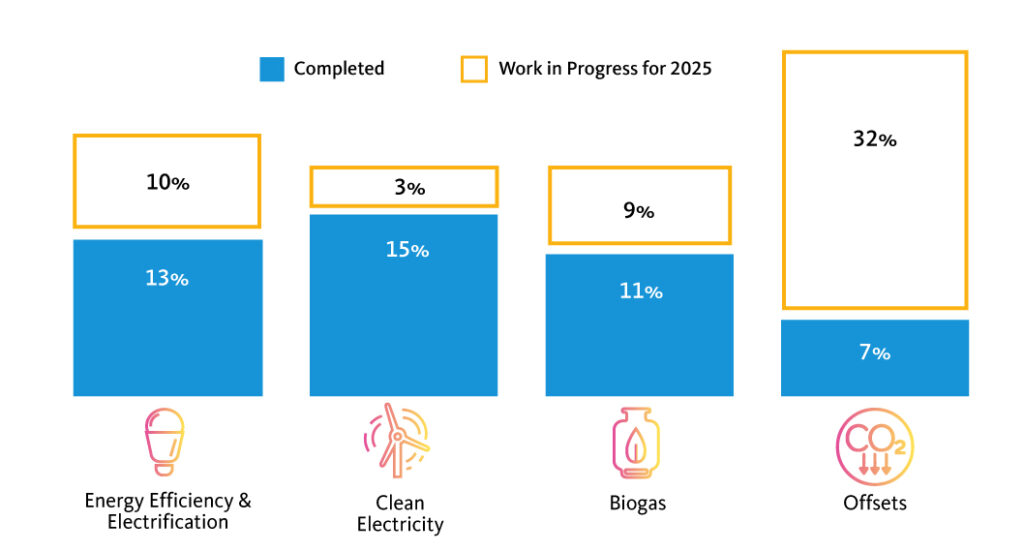
The University is committed to maintaining and further reducing emission levels moving forward. All campuses have plans in place for moving toward carbon neutrality by 2025 that rely on a variety of strategies. UC Merced has already met this milestone.
The Projected Path to Carbon Neutrality
Last year, the systemwide Climate Change Working Group (CCWG) proposed new policy language for the Sustainable Practices Policy that establishes standards governing the procurement of high-quality offsets consistent with UC’s mission of education, research and public service. The proposed policy language prioritizes direct reductions of emissions and does not require UC to purchase carbon offsets to meet carbon neutrality goals. Instead, the policy would establish priorities and minimum standards that apply if campuses decide to purchase offsets. The proposed policy language is being reviewed and may be published in 2022. The Carbon Abatement Technical Committee is also developing guidelines for the purchase of offsets.
The CCWG also drafted policy language requiring campus Climate Action Plan updates to integrate environmental justice, adaptation and resilience. To this end, a series of workshops were completed in 2021 to help UC locations start addressing the impacts of a changing climate with a justice, equity, diversity and inclusive approach.
Energy
To achieve carbon neutrality, the University is efficiently using its resources and changing the sources of energy that campuses and health systems consume.
Energy Efficiency
Since UC formalized its Energy Efficiency Partnership with the California utilities in 2004, more than 1,100 energy efficiency and new construction projects have been completed under the program. These projects will have received an estimated $100 million in incentive payments and avoided more than $30 million in annual energy costs, net of debt service. At the time of this report, an additional 46 energy efficiency projects are expected to be completed in 2021. These projects will earn $5.4 million in incentives and are projected to avoid $2.2 million annually in energy costs, net of debt service. Despite these accomplishments, the investment in energy efficiency projects has slowed in recent years.
UC is advancing the next iteration of the Energy Efficiency Partnership through an innovative Clean Energy Optimization Pilot (CEOP) program with the utility Southern California Edison, which prioritizes ongoing carbon reductions through metered performance in energy efficiency and other on-site actions. The CEOP will allow UC to implement a much wider array of technology and behavioral solutions that best suit the needs of participating campuses and health systems, with structured incentives that support lasting greenhouse gas (GHG) reductions. Moreover, the new approach aligns directly with California’s aggressive GHG reduction goals, using universities as learning laboratories across broad energy end uses to evaluate and support scalable solutions.
In July 2019, five UC locations began participating in CEOP and completed the first performance period, which ended March 31, 2020, prior to the COVID-19 impacts to campus operations. In total, UC’s participating campuses created lifetime emissions savings of more than 37,000 metric tons of carbon dioxide. As a result, participating campuses received more than $3 million in program incentives. The three primary actions these locations have taken to reduce emissions include pursuing energy efficiency projects, shifting energy demand to low-carbon-intensity periods (such as during the day, when solar projects are in operation) and investing in on-site renewable energy such as solar. During the reduced occupancy periods driven by the COVID-19 pandemic, the CEOP temporarily put performance payments on hold to address the related operational and programmatic impacts. CEOP will restart once UC resumes normal operations.
Energy use intensity (EUI) is the industry standard metric to report relative energy use. EUIs are calculated by totaling all of the energy used by a location and dividing by the associated square footage. EUIs should not be compared from location to location, as weather and building types drive energy use.
UC’s policy goal is to have each campus decrease its EUIs by an average of 2% each year. Systemwide, UC has historically met this goal until the 2019 reporting year, when the University’s systemwide EUI increased. For the 2020 reporting year, systemwide EUI decreased significantly as a result of the coronavirus pandemic driving decreases in campus occupancy and energy use, allowing UC to make up ground and achieve the 2% goal. However, it remains to be seen if the system can maintain these savings and continue to meet this goal moving forward.
Renewable Energy and the UC Clean Power Program
In an effort to both reduce demand on the electricity grid and obtain local clean energy, the University has over 100 renewable energy projects across the system, including all 10 campuses, Agriculture and Natural Resources sites and the Office of the President. On-site renewable generation capacity is more than 52 megawatts systemwide, with individual projects ranging in size from 2 kilowatts to 16.3 megawatts. According to the U.S. Environmental Protection Agency, UC uses more green power than any other college or university in the country and ranks seventh in onsite green power generation compared to all corporations and governments, trailing only entities like Apple and Walmart.
In addition to UC-sited projects, campuses and health systems are also obtaining renewable energy from a variety of off-site sources, such as utility and municipal retail tariff options, and/or participation in UC’s clean power program (UC Clean Power). Overall, 55% of UC’s electricity use comes from renewable or carbon-free sources.
UC Clean Power currently supplies approximately 30% of the University’s electricity, serving eight campuses and three health systems that are eligible to select an alternative energy provider. Recent regulatory changes will allow more campus participation in UC Clean Power, which should be able to serve 35% to 40% of the University’s electricity needs in 2021. UC Clean Power’s 2019 carbon intensity was zero pounds of CO2, as reported to the Climate Registry and verified by an independent third party. The UC Clean Power supply portfolio includes power generated by two Fresno County solar projects under long-term contracts, as well as other renewable and clean energy sources. Additionally, the portfolio will soon include generation from a third long-term contract for solar projects in California, which will also supply renewable energy credits to campuses and accounts that are not served by UC Clean Power.
Biogas
In 2021, two of the projects supplying the University with carbon-neutral biomethane began production. The first facility, located in Rialto, California, diverts organic waste from landfills — consistent with UC’s zero waste goals and California’s recycling policies — and converts it into biomethane. The other, UC’s largest biomethane project, which captures methane from a landfill that was previously being flared, is scheduled to begin delivery at the end of 2021. These supply agreements represent approximately 10% of UC’s fossil natural gas consumption and move the University closer to the goal of supplying the entire system with about 40% biomethane to reduce scope 1 emissions. The University also invested in new technology at the Shreveport landfill to improve methane capture and biogas production.
Food Service
In fiscal year 2020–21, approximately 19% of the University’s food purchases met one or more sustainability criteria. This represents over $10.9 million going to sustainable food suppliers. While the total amount spent on food (and therefore sustainable items) by UC locations decreased from the previous year due to limited food service operations and supply chain interruptions, the amount that the campuses and health systems spent on sustainable food increased by approximately three percentage points compared to the previous year.
COVID-19 had disparate impacts on UC locations, and therefore their food and beverage spending. However, for the majority of the year, “to go” operations were the norm for most campuses, and many food service locations had reduced hours or remained closed. In spite of the pandemic-related challenges, the University continued to act on sustainability in its food supply chains. In particular, spurred by COVID-19 outbreaks in the poultry supply chain, the University sent a letter to all of its major suppliers, reiterating the importance of worker health and safety during the pandemic. This letter was endorsed by the systemwide Sustainable Foodservice Working Group and signed by UC’s chief financial officer and chief operating officer. UC is now working with other universities, such as Georgetown and the University of Michigan, to continue to promote health and safety in food supply chains nationally. Additionally, the University integrated social and environmental sustainability into a procurement process to select beef suppliers. Other work with suppliers included partnering with dairy and produce distributors on data transparency and reporting.
At a campus level, University stakeholders also collaborated on healthy vending machine options, phasing out single-use plastic, and food recovery and security.
General Sustainability Performance Assessment
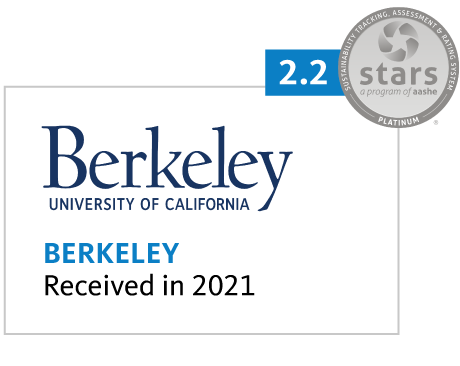
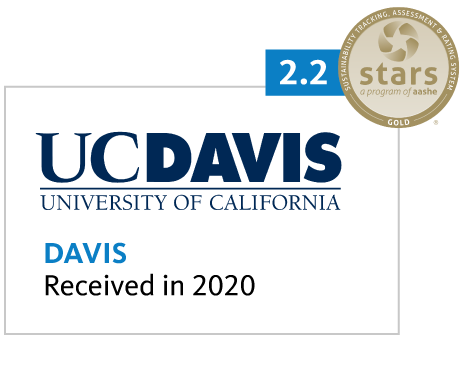
The policy section on general sustainability performance assessment requires all undergraduate campuses to maintain a current certified Sustainability Tracking, Assessment and Rating System (STARS) report. A new STARS report must be submitted at least once every three years and campuses are required to maintain a Silver rating in STARS, and strive for Gold by 2023.
STARS is the leading North American sustainable campus rating system that was developed by colleges and universities, including UC. STARS is a transparent, self-reporting framework for colleges and universities to measure their sustainability performance. STARS provides the foundation for other campus sustainability rankings, such as Sierra Cool Schools, and is a primary standard by which peer institutions evaluate their overall achievements and progress in sustainability.
All undergraduate UC campuses participate in the STARS rating system. Seven campuses currently hold a Gold rating. UC Berkeley and UC Irvine now both have a Platinum rating. The Sierra Club also ranked five UC campuses in the top 20 in its 2021 Cool Schools rankings, including three UC campuses in the top 10. UC campuses, health systems and Lawrence Berkeley Laboratory received many additional awards in 2021.
Green Building
The University had only one LEED green building certification when it adopted green building policy requirements in 2004, but as of the end of the 2020–21 fiscal year, it now has 384 LEED certified building projects. This number represents over 33 million square feet of certified green building space. Over the past year, UC added 16 new LEED certifications, including three LEED Silver, nine LEED Gold and two LEED Platinum certifications.
UC’s Sustainable Practices Policy also requires energy-efficient design above and beyond LEED certification. In fiscal year 2020–21, 20 UC projects were able to register with their local utility company’s Savings By Design program to receive over $3 million in energy efficiency incentives. On average, these projects exceeded the energy provisions of California’s Building Code by 27% and together are projected to save over $1 million annually in energy costs.
UC will no longer approve new buildings or major renovations that use on-site fossil fuel combustion (e.g., natural gas) for space and water heating, except under special circumstances. The University has 39 buildings either completed or in design and construction that comply with this new policy. These projects encompass all major building types, including housing; academic, office and administrative buildings; and medical and laboratory buildings.
Over the past year, the Green Building Working Group sponsored the Future Climate Realities Project to provide campus-specific temperature and rainfall data under different climate change scenarios. It also helped develop a tool to estimate operational energy use and carbon emissions from new construction projects during a project’s preliminary planning stage. These tools will help inform design decisions to support climate-smart, resilient buildings.
Health and Well-Being

The University’s newest addition to its Sustainable Practices Policy is a section dedicated to health and well-being, a collaboration between the UC Healthy Campus Network (HCN) and the UC Sustainability Steering Committee.
HCN is committed to making UC and California a healthy place to work, learn and live for students, faculty and staff, and is diving deeper into sustainability work. The new health and well-being policy section will first prioritize new campus vending machine guidelines focused on healthy food and beverage options and address the procurement of chemicals of concern as defined in the UC Sustainable Procurement Guidelines. The vending machine policy work will take inspiration from the 2018 UC Healthy Vending Policy Implementation and Best Practices Toolkit created under the Global Food Initiative.
To accomplish these tasks, the University created a Sustainability and Well-Being Policy Working Group in summer 2021, with 35 members representing all UC campuses, health systems and Lawrence Berkeley National Laboratory. The working group includes both staff and faculty with expertise in sustainability or health and well-being. HCN leadership has also identified faculty, senior administrator experts and student fellows who will identify and examine the impacts of the UC Sustainable Practices Policy on health and equity by utilizing an approach outlined in the American Public Health Association’s Health in All Policies. Health in All Policies champions health equity by weaving it into the fabric of institutions and can assist and advocate in developing recommendations on: environmental and human health co-benefits; social, physical, and emotional well-being; health equity; and measures to track progress.
Procurement
Despite significant financial losses and global supply disruptions caused by the COVID-19 pandemic, procurement staff mobilized to support campuses and health systems in their efforts to secure necessary personal protective equipment and services while maintaining research, health care services and teaching.
The University also kept up its commitment to sustainability in sourcing and supply chains in many ways. For example, UC reasserted the importance of worker health and well-being during the pandemic by issuing a letter, signed by UC’s chief procurement officer and chief operating officer, to over 300 major suppliers to the University. The letter stated UC’s commitment to driving social and environmental performance improvement and collaborating with suppliers to improve the health and safety of its extended supply chains. The letter was endorsed by several systemwide groups.
Progress continued with UC’s supplier sustainability scorecard initiative, with an increase in rated suppliers and licensees from 102 to 135 since last fiscal year. Of these companies, 19% are considered “advanced” or “outstanding” in their corporate social responsibility performance for their industry by EcoVadis, down 5% since last year.
UC requires at least 15% of the points used in evaluating Best Value RFPs be dedicated to sustainability factors. Of note, strict sustainability requirements and evaluation questions were included in both the Dormitory and Mattresses and the General Lab Supplies bids last year.
At the time of this report, sustainable procurement data was not yet available for fiscal year 2020–21. Fiscal year 2019–20 data is available in the 2020 Annual Sustainability Report.
UC Code of Conduct for Trademark Licensees
The persistent global impacts of the COVID-19 pandemic on the individuals, communities and businesses that comprise the global marketplace for university licensed products were the primary focus of the University of California Code of Conduct for Trademark Licensees Steering Committee in fiscal year 2020–21.
Interconnected challenges among university licensers, retailers of products, licensee businesses, and the workers and communities in university licensed supply chains became increasingly evident during the pandemic. In response, the steering committee engaged with experts from academia, the nonprofit sector and business to:
- Explore how buying practices of universities, retailers and licensees impact factories and workplace rights, conditions and pandemic safety protocols through betterbuying.org.
- Learn how UC students are creating new resources to assist peers in aligning purchases with ethical and responsibly made licensed products.
- Amplify the COVID-19 workplace protocols developed by the nonprofit organizations with which the University of California is affiliated, the Fair Labor Association and the Worker Rights Consortium, to vendors from which University of California purchases supplies and services.
- Influence the licensee perspective on remedying workers’ rights violations at a Central American supplier factory during the pandemic through responsiveness to worker advocacy groups and collaboration.
The impact of the University’s licensed product manufacturing extends to 45 countries where 3,300 transparent, disclosed suppliers manufacture for 345 licensee companies that have permission to use university trademarks on products that are sold to the public.
Sustainable Building Operations and Laboratories
laboratories across the UC
system are certified as green
Despite the challenges posed by the pandemic, the University incorporated sustainability requirements into a General Lab Supplies procurement bid that was released in 2021. Additionally, campuses reported that over half of their autoclaves now have water efficiency measures.
All campuses have completed at least three assessments through their green lab assessment programs. By the end of fiscal year 2020–21, the cumulative number of laboratories certified as green by campuses totalled 346. This number represents only a small increase — 3 percentage points — from the previous year. Systemwide, green lab certifications slowed down because of staff density restrictions in research labs as a result of the COVID-19 pandemic, and some Green Labs programs were put on pause. Similarly, campuses also reported that they directly engaged only approximately 1,000 researchers in sustainability efforts this past fiscal year, or half as many as the previous year. Going forward, campuses are discussing how to adapt their engagement strategies around sustainability in a COVID-19 world.
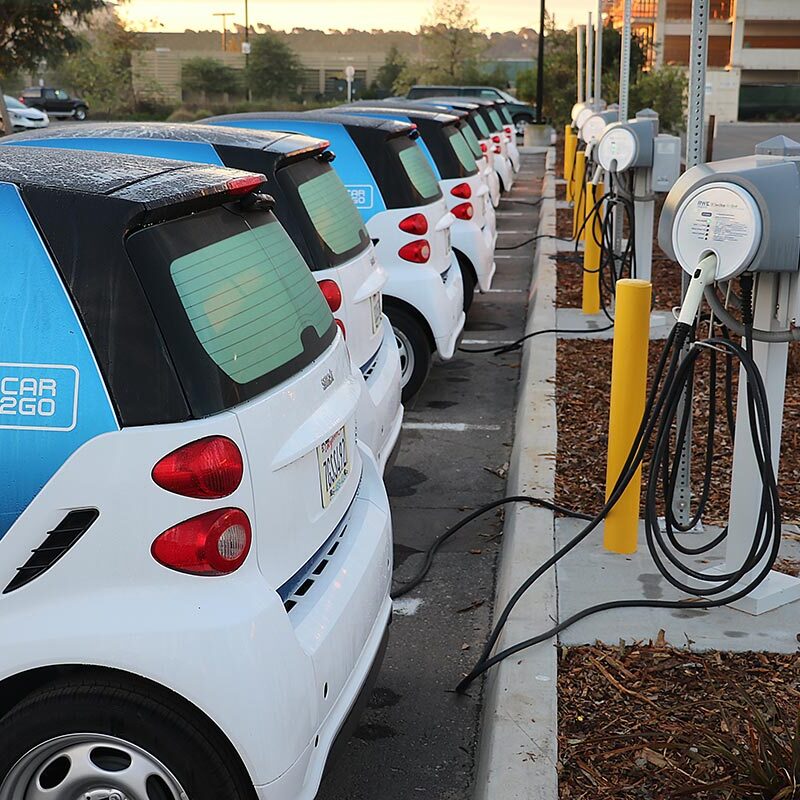
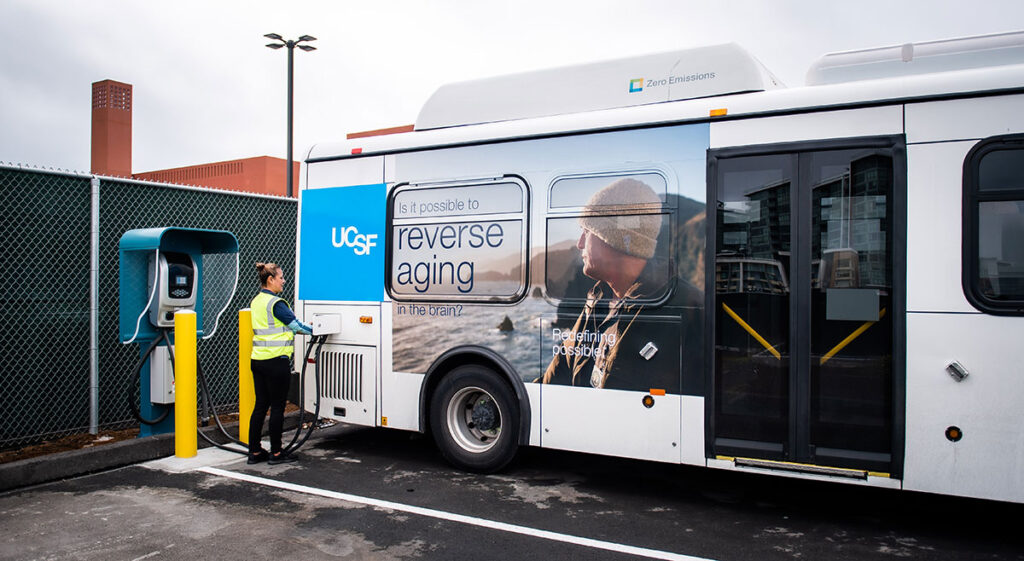
Transportation

EV charging stations throughout the UC system

of light-duty vehicles acquired in 2021 were electric (zero-emission) or hybrid vehicles
The University of California continued making progress toward its 2025 and 2050 transportation goals. Systemwide, 50% of all new light-duty fleet vehicles purchased in fiscal year 2020–21 were battery-electric, plug-in hybrid or gasoline-electric hybrid vehicles, helping to move fleet emissions closer to carbon neutrality. Most locations reported significant teleworking during the pandemic.
Although operational changes due to COVID-19 interfered with normal data collection, most campuses reported significant drops in single-occupancy commute rates in fiscal year 2020–21 as students, faculty and staff participated in remote work and learning. The shift was less pronounced in the health systems, whose essential workers continued to provide in-person services throughout the pandemic. The University has installed 1,409 electric vehicle charging stations to support the conversion of fleet and commute vehicles to electric options.
In fiscal year 2020–21, campus transportation offices actively engaged in supporting the shift to remote work and learning, reforming transportation policies and programs in response to budget constraints stemming from significant declines in parking revenue and planning for the return of students, faculty and staff to campus.
UC Health
Recognizing the unique challenges and opportunities for implementing sustainable practices in health care facilities, the University of California updated its Sustainable Practices Policy in 2018 to add a section devoted to sustainability at UC Health.
In 2021, the University added new waste reduction goals for hospitals and synced how the health systems are reporting on waste systemwide for the first time. In fiscal year 2020–21, the health systems produced, on average, about 30 pounds of waste per adjusted patient day, which they aim to bring down to 20 pounds by 2030. For the future, UC Health is also discussing the addition of waste diversion goals and new sustainable procurement goals related to medical device reprocessing and other commodity categories.
UC Health continues to be on the front lines of COVID-19. In addition to managing the pandemic, UC’s hospitals are working to address food insecurity in communities hardest hit by COVID-19.
The health systems also dealt with the health impacts of climate change and the recent large wildfires. Research from the UC Health systems showed that climate change will give rise to more cancers and contribute to detrimental health effects on children (from phenomena such as wildfire smoke), and that poor air quality from wildfire smoke can be linked to diseases such as Alzheimer’s. UC research also pointed out that greening hospital operations can combat climate change.
Additionally, in light of the state’s drought crisis, UC Health’s hospitals are working to conserve water. All of this sustainability work by UC’s hospitals was recognized by Practice Greenhealth, the industry body for sustainability in health care. Each health system received an Environmental Excellence Award.
Water
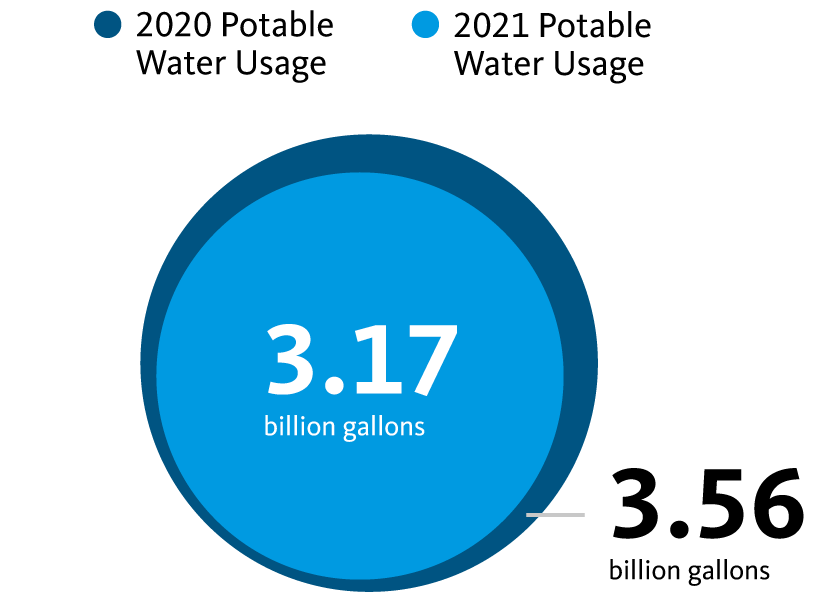
The University’s 2025 water reduction goal — to reduce growth-adjusted potable water consumption 36% by 2025, when compared to a three-year average baseline of fiscal years 2005–06, 2006–07 and 2007–08 — is normalized per capita, which resulted in radical fluctuations in data due to reduced campus populations during the COVID-19 pandemic. As a result, the 2021 Annual Sustainability Report illustrates the difference in water consumption for UC locations between fiscal year 2019–20 and fiscal year 2020–21, instead of measuring progress toward the 2025 goal.
Data from fiscal year 2020–21 shows that the University reduced its water usage overall by over 390 million gallons compared to the year before. However, for most of UC’s campuses, water use did not decrease proportionally to the number of individuals who were not on site. This data demonstrates that there are many drivers for water use in UC that are independent of population, including cogeneration plants, building cooling, laboratory processes and irrigation, many of which had to remain active to support the research and essential operational activities of the University.
Given the severity of the current drought in California, UC campuses and health systems are continuing to identify additional reductions and share best practices across the University.
Zero Waste
Despite the ongoing pandemic, campuses have adapted operations while still striving for sustainable outcomes.
The majority of the University’s campuses experienced minimal losses in their diversion rates, with three demonstrating modest improvement in fiscal year 2020–21. In fiscal year 2020–21, the University diverted about 70% of municipal solid waste and construction and demolition wastes from being sent to landfills and generated significantly less total waste.
However, with relatively few people on campus, per capita waste generation doubled to 1.9 pounds per person per day. This likely reflects how many waste generating processes (landscaping, lab experiments, building maintenance, etc.) continue independently from the number of people on campus.
Last year, the systemwide Zero Waste Working Group focused on single-use plastics, organics diversion and food waste recovery, and diversity, equity and inclusion. The working group developed templates, guides and outreach materials for implementing the single-use plastics policy at each campus.