Climate Protection – Emissions
The University of California’s greenhouse gas emissions systemwide decreased slightly in 2019 by roughly 1% compared to 2018, with about a 4% increase in scope 1 emissions, 20% decrease in scope 2 emissions, and a minor decrease in scope 3 emissions. Scope 2 emissions in 2020 are expected to decrease even further as the UC Power Program is now procuring 100% clean electricity. Scope 3 emissions are also expected to decrease in 2020 as a result of reduced air travel and commuting due to the COVID-19 pandemic.
the projected path to carbon neutrality

Where are we on the path to being carbon neutral?
UC continues to make progress on its path toward carbon neutrality by 2025. Despite significant growth in population and building space, the University has reduced its total scope 1 and scope 2 greenhouse gas emissions by 15% since the Carbon Neutrality Initiative was announced in 2013.
Energy – Efficiency Cost Savings
At the time of this report, 61 energy efficiency projects costing about $11.5 million are expected to be completed in 2020. These projects will earn $6.1 million in incentives and are projected to avoid $2.1 million annually in energy costs, net of debt service.
In July 2019, five UC locations began participating in CEOP, and preliminary results project that many of them will have emissions reductions and, as a result, will receive incentives in the range of $1 million or more. For now, the CEOP temporarily put performance payments on hold to address the impacts of the coronavirus on operations.
Energy Use Intensity (EUI)
Energy use intensity (EUI) is the industry standard metric to report relative energy use. EUIs are calculated by summing up all of the energy used by a location and dividing by the associated square footage. EUIs should not be compared from location to location, as weather and building types drive energy use.
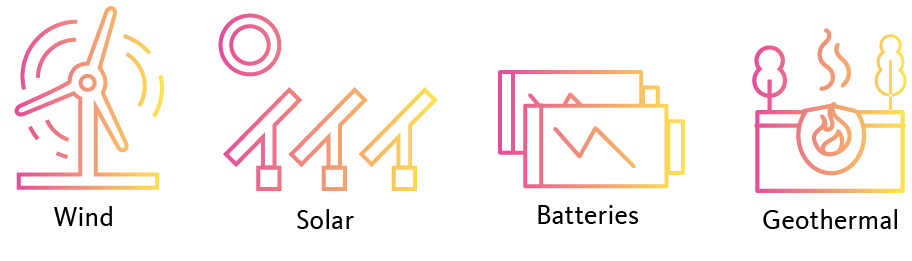
Energy – Renewable Electricity Generation
UC Power supplies approximately 25% of the University’s electricity use to eight campuses and three health systems that are eligible to select alternative energy providers. Pursuant to a limited expansion of customer choice recently enacted in California, participation in UC Power will increase by 20-30% in 2021.
The University’s supply portfolio for UC Power includes power generated by two Fresno County solar projects under long-term contracts, as well as other renewable and clean energy sources. The portfolio will soon also include generation from a third long-term contract for California-sited solar, which will also supply Renewable Energy Credits to campuses and accounts that are not served by UC Power.
Food
Each University of California campus and four health systems achieved the 2020 policy goal of purchasing 20% sustainable food ahead of schedule, leading to new 2020 sustainable food procurement goals. Two of the most notable changes in the revised policy is the de-emphasis of “local” as a sustainability criterion and greater attention on plant-based food products. Additionally, campuses and health systems increased their targets for sustainable food procurement, to 25% for campuses and 30% for health systems by 2030. As to be expected with the adoption of the new, stricter standards, the percentage of food purchases that meet sustainability criteria dropped systemwide.
There are many challenges that may impact achieving this goal. In March 2020, food service facilities across the University felt the dramatic impacts of the COVID-19 pandemic. Campuses shifted to remote work and instruction, many students and residents returned home, and foodservice operations closed or served significantly fewer meals as a result. Most foodservice operations experienced losses to revenue and are now expecting to work with tighter budgets going forward. Further, campuses will be challenged by the uncertainties of unknown guest counts (as campuses partially reopen), shifting health and safety guidelines around COVID-19, supply chain shortages and staffing imbalances leading to job insecurity.
Green Building
The University now has 352 LEED certified building projects, totalling over 29 million square feet. UC’s Sustainable Practices Policy also requires energy-efficient design above and beyond LEED certification. In fiscal year 2019-20, three UC projects qualified to register with their local utility company’s Savings By Design program in order to receive over $850,000 in energy efficiency incentives. On average, these projects exceeded the energy provisions of California’s Building Code by 35% and are projected to save approximately $260,000 annually in avoided energy costs.
Procurement
UC reported on green spend goals for the second year in a row. However, the coronavirus pandemic impacted UC’s these goals. Spend in the cleaning supplies categories was compromised, for example, and many campuses had to seek out new suppliers because of product shortages. Systemwide, UC continues to meet its green goals in the categories of cleaning supplies, electronics, and indoor office furniture. However, individual UC locations are still purchasing products that do not meet minimum sustainability policy requirements in these categories.
In the future, UC hopes to report data on water appliances and fixtures, as well as compostable food service ware. Additionally, because of data limitations, campus-level data on office supplies is not available this year. UC hopes to report more product category data for campuses in the future as well.
Sustainable Building & Laboratory Operations
Due to COVID-19-related campus closures that began in March 2020, the green labs certification processes experienced a slowdown. Direct implementation of green labs programs and surveying researchers became challenging for many campuses, which reported their numbers of certified green labs could have been higher. Going forward, campuses are discussing how to adapt their engagement strategies around sustainability in a COVID-19 world.
In other green labs work, campuses are reducing the number of autoclaves on single-pass cooling to conserve water by both replacing older autoclaves with newer models and retrofitting existing autoclaves. Systemwide, single-pass cooling has been eliminated in 32% of autoclaves.

laboratories across the University of California system certified as green

increase in labs assessed from the previous year
Transportation
Almost half of UC locations reduced the single-occupancy vehicle commute rate of students and employees. Before the COVID-19 outbreak, campuses continued to introduce new or strengthen existing alternative commuting incentive programs, such as bike-sharing, scooter sharing, and commute club offerings. With the campus shutdowns that began in March, however, transportation teams had to change their focus from sustainable transportation to telecommuting.
Electric vehicle (EV) options continue to expand. Plug-in hybrid and gasoline-electric hybrid SUVs are in use by two UC campuses. The proportion of buses with net-zero mobile
source emissions at UC campuses also continues to increase with multiple new battery-electric minibusses and full-size transit buses now in operation.
EV charging stations throughout the UC system
locations report progress on decreasing their combined single-occupancy vehicle commute rates for employees and students

of light-duty vehicles acquired in 2020 were Electric Vehicles (zero-emission) and Hybrid
Water
The University of California reduced its water usage by 47% from the three-year average baseline of 236,048 gallons per capita.
Due to COVID-19 public health orders that resulted in a lower census systemwide, per capita water use calculations reflect a greater than predicted reduction in overall water use. Currently, all campuses, Lawrence Berkeley National Laboratory, and the UC Office of the President are on track to achieve the interim goal of 20% reduction by the 2020-21 fiscal year.
Zero Waste – Generated
In fiscal year 2019-20, per capita waste generation for UC campuses was at 1.2 pounds per person per day, which is a 12% decrease from last year, and a 28% decrease from the baseline year, fiscal year 2015-16. The decrease in per capita waste generation is also likely a result of the COVID-19 pandemic, due to campus closures that occurred in early March 2020.
Zero Waste – Diverted
The University’s long-term waste goals were unfortunately impacted by the pandemic. In fiscal year 2019-20, campuses diverted 62% of their municipal solid waste, and when including construction and demolition debris information, the diversion rate increased to 67%. Unfortunately, the observed diversion rates dropped slightly from the previous year, which can likely be attributed to the COVID-19 pandemic and the associated decreased populations on campus, dramatic shifts in materials accepted for recycling, and the cancelation of large coordinated recycling efforts and events that normally take place every year, such as move-out and department clean-outs.
General Sustainability Performance Assessment

UC campuses have a current STARS Gold rating, exceeding policy expectations

UC Irvine achieved a STARS Platinum rating, one of only nine universities in the world to do so
The University added a new requirement in 2020 to ensure all undergraduate UC campuses are recognized leaders for having comprehensive sustainability programs across academics, engagement, operations, planning, and administration. It provides campuses the opportunity to track and report performance across a fuller breadth of sustainability efforts, in addition to the previous operations metrics.
STARS is the leading North American sustainable campus rating system developed by colleges and universities (including UC) for colleges and universities. STARS provides the foundation for campus sustainability rankings such as Sierra Cool Schools and Princeton Review, and is a primary standard by which peer institutions evaluate overall achievements and progress in sustainability. Nearly 1,000 colleges and universities have registered for STARS.
Investments
Reducing Climate Risk to the Investment Portfolio

Reduction in CO₂e emissions footprint in 2020 portfolio from 2019 portfolio

Equivalent amount of passenger vehicles removed from the road
In 2019 UC’s Investments’ public equities portfolio carbon footprint was 169 tons of emissions (CO₂e) per million invested. This results in about 7.9 million tons CO₂e total.
In 2020 UC’s Investments’ public equities portfolio carbon footprint was 86 tons of emissions (CO₂e) per million invested. This results in about 4.4 million tons CO₂e total.
Our portfolio emits 3.5 million tons less than it did in 2019. Over the course of 2019, in order to reduce risks, UC Investments sold roughly $1 billion in holdings of companies that own reserves of thermal coal, oil and gas. As a result of our decision, the carbon footprint of our investment portfolio shrank significantly.
Renewable Energy Investments around the world
The University of California’s commitment to sustainability carried out through investment efforts has had a global impact.
Over 1.7 gigawatts of wind, solar and battery storage were installed in the US, Canada, Ireland, India and Japan due to UC’s cumulative investment.