
Climate
Most campuses (including their associated academic health centers) continue to achieve the University’s climate policy goal of reducing greenhouse gas emissions to 1990 levels (based on reported emissions that will be verified by a third party by early 2023).
UC’s greenhouse gas emissions are reported on a calendar year basis, so the 2022 report includes emissions through the end of 2021. Those emissions were about 20% lower than pre-pandemic levels, largely due to decreased air travel and commuting. However, those travel-related emissions increased by about 21% in 2021 relative to 2020. Campuses purchased compliance offsets to comply with California’s Cap-and-Trade regulation, and also purchased some voluntary carbon offsets. Together, these offsets reduced reported emissions by about 6%. Excluding offsets, UC’s emissions decreased by approximately 40% in 2021 relative to 2012, before the Carbon Neutrality Initiative was launched.
The University is committed to maintaining and further reducing emissions levels moving forward. All campuses have plans in place for moving toward carbon neutrality by 2025 that rely on a variety of strategies.
The Projected Path to Carbon Neutrality
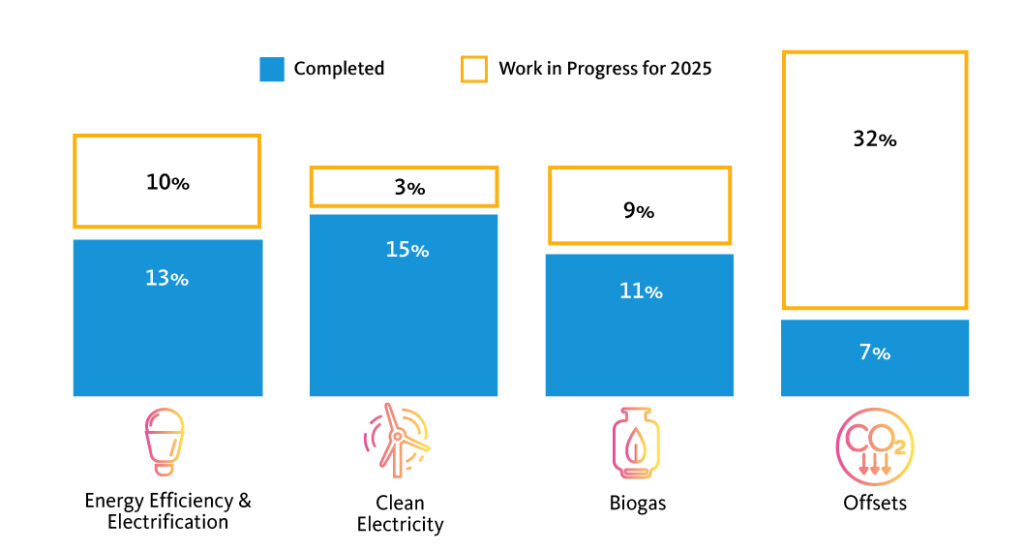
Last year, a systemwide Offsets Technical Committee convened to develop a strategy to procure high-quality offsets consistent with the principles laid out in the Sustainable Practices Policy and UC’s mission of education, research and public service. This strategy relies on purchasing UC-initiated offsets when possible and high-quality market offsets that have been vetted to meet UC policy standards.
Additionally, the University coordinated a series of equity-centered climate resilience workshops at each UC location. These workshops engaged a broad range of community stakeholders to begin identifying how climate vulnerabilities will impact campuses and academic health centers. The University also developed a Framework for Incorporating Climate and Environmental Justice into Climate Action and is supporting campuses to integrate diversity, equity and inclusion into their climate planning processes.
Diversity, Equity, Inclusion and Justice

Following its creation during the summer of 2021, the University’s Sustainability and Diversity, Equity, Inclusion and Justice (DEIJ) Working Group has sought to engage a broad range of campus and health system stakeholders to inform its work. In 2022, the working group created an advisory council, composed of UC students, faculty and staff, that meets quarterly to provide critical input on how to best incorporate DEIJ into UC sustainability programs and policy.
Additionally, the working group sent a letter to the UC Offsets Technical Committee, urging them to include DEIJ criteria as part of the review of any carbon offset project that the University of California considers purchasing. As the DEIJ Working Group develops, it will continue to ensure that UC sustainability decision-making processes, policies and programs are rooted in a spirit of collaboration and DEIJ principles.
Energy
To achieve carbon neutrality, the University is efficiently using its resources and changing the sources of energy that campuses and academic health centers consume.
Energy Efficiency
Since UC formalized its Statewide Energy Partnership with California’s utilities in 2004, more than 1,100 energy efficiency and new construction projects have been completed under the program. These projects will have received approximately $100 million in incentive payments and avoided more than $30 million in annual energy costs, net of debt service.
As a metric for relative efficiency, energy use intensity (EUI) is calculated by totaling all of the energy used by a location and dividing by the associated square footage. In 2021, UC locations retained many of the energy reductions realized from the coronavirus pandemic, even with increased occupancy, and continued to drive EUI even lower.
Renewable Energy and the UC Clean Power Program
To reduce demand on the electricity grid and obtain local clean energy, the University has over 100 renewable energy projects across the system, including all 10 campuses, Agriculture and Natural Resources sites and the Office of the President. On-site renewable generation capacity is more than 52 megawatts systemwide, with individual projects ranging in size from 2 kilowatts to 16.3 megawatts. According to the U.S. Environmental Protection Agency, UC continues to use more green power than any other college or university in the country and ranks sixth in on-site green power generation compared with all reporting entities.
In addition to UC-sited projects, campuses and academic health centers are obtaining renewable energy from off-site sources, such as utility and municipal retail tariff options and participation in UC’s own self-provided electricity program (“UC Clean Power”). Overall, 55% of UC’s electricity use comes from renewable or carbon-free sources.
UC Clean Power currently supplies approximately 40% of the University’s purchased electricity, serving portions of nine campuses and five academic health centers that are eligible to participate. UC Clean Power’s 2019 carbon intensity was zero pounds of CO2, as reported to The Climate Registry and verified by an independent third party; the carbon intensity for 2020 and 2021 will also be zero, pending final verification. The program’s portfolio includes power generated by two Fresno County solar projects under long-term contracts, as well as other renewable and carbon-free sources. Additionally, the portfolio will soon include generation from a third long-term solar contract in California, which will also supply renewable energy credits to campuses and accounts that are not served by UC Clean Power.
Biogas
In 2022, the University completed contracts to receive biomethane from two landfills that were previously flaring the biogas. Additionally, the University invested in an expansion of the biogas collection system at the Shreveport landfill, which will result in an improvement in methane capture and biogas production. These new projects bring UC approximately halfway to its goal of displacing fossil natural gas and supplying the entire system with 40% biomethane to reduce scope 1 emissions, with campus deliveries beginning in 2025.
Food Service

of food and beverage purchases met sustainability criteria ($27.2M)
of food and beverage purchases were plant-based ($40.5M)
In fiscal year 2021–22, approximately 19.5% of the University’s food purchases met one or more sustainability criteria. This represents over $27 million going to sustainable food suppliers, $17 million dollars more than the previous year. Eleven locations were able to increase their percentage spend on sustainable food and beverages.
Of the University’s total food and beverage spend, 29%, or $40.5 million, was on plant-based food items. The total amount spent on food (and therefore sustainable items) by UC locations increased from the previous year due to campuses reopening food service operations after many outlets were previously closed because of the pandemic.
Most UC location food service operations resumed full operations after COVID-19 restrictions were lifted, and many are prioritizing sustainable proteins. For the first time, the University also explored a systemwide contract with a supplier for grass-fed and California-raised beef.
University stakeholders continue to collaborate on healthy vending machine options, phasing out single-use plastic, improved data reporting and food recovery and security.
General Sustainability Performance Assessment
All nine undergraduate UC campuses participate in the Association for the Advancement of Sustainability in Higher Education’s Sustainability Tracking, Assessment and Rating System (AASHE STARS). Six of the nine campuses currently hold a Gold rating. The other three undergraduate campuses, UC Merced, UC Berkeley and UC Irvine, now have a Platinum rating, the highest STARS ranking.
STARS is the leading North American sustainable campus rating system that was developed by colleges and universities, including the University of California. STARS is a transparent, self-reporting framework for colleges and universities to measure their sustainability performance. STARS provides the foundation for other campus sustainability rankings and is a primary standard by which peer institutions evaluate their overall achievements and progress in sustainability.
UC campuses, academic health centers and Lawrence Berkeley National Laboratory received many additional awards in 2022.
Green Building
The University has 408 LEED-certified green building projects (35 million square feet). During fiscal year 2021-22, UC added 25 new LEED certifications, including 5 LEED Silver and 20 LEED Gold buildings.
UC no longer allows on-site fossil fuel combustion (e.g., natural gas) for space and water heating in new buildings or major renovations, except under special circumstances. The University currently has 16 occupied electric buildings (over 2 million square feet) and another 34 buildings (over 8 million square feet) in planning, design or under construction. These projects encompass all major building types.
Health and Well-Being
The Healthy Campus Network, in partnership with sustainability staff, launched the Sustainability and Well-Being Working Group in 2022 after the passage of the new Health and Well-Being section in the Sustainable Practices Policy.
The group initiated a Health in All Policies Assessment (HiAP) of the policy and worked on developing new systemwide goals around healthy vending and the procurement of chemicals of concern, which will likely be forthcoming in 2023. The vending and chemical goals build off of previous work initiated by the UC Global Food Initiative and the Sustainable Procurement Working Group. The new HiAP process was driven by 10 undergraduate and graduate student fellows and their mentors, who assessed the Sustainable Practices Policy through a health-focused lens by reviewing existing language, published research and basic practices around sustainability topics areas, and interviewing key stakeholders and experts. An executive summary report of the findings, with recommendations for incorporating health into future sustainability policies, is expected to be finalized in 2023.
Procurement

green spend on electronics (39%)

green spend on cleaning supplies (65%)

green spend on indoor office furniture (95%)

green spend on office supplies (38%)
Green spend is defined as meeting preferred or minimum criteria in UC’s Sustainable Procurement Guidelines.
Suppliers reporting: Electronics (12), Furniture (5), Cleaning supplies (6), Office supplies (3).
UC Systemwide Spend Analytics category data provided by CalUSource.
Despite ongoing global supply disruptions caused by the COVID-19 pandemic, procurement staff mobilized to support campuses and academic health centers to maintain research and teaching. Utilizing tools such as Ecovadis, UC is continuing to partner with its strategic suppliers on improving the sustainability of their supply chains.
Last year, the University revised its Sustainable Procurement Guidelines to add new commodity categories (such as flooring and lighting) and to update guidance on existing products, especially to align with the Association for the Advancement of Sustainability in Higher Education’s Sustainability Tracking, Assessment and Rating System (AASHE STARS). The guidelines also clarified accepted certifications and labels for economically and socially responsible spend.
The University was able to obtain data for $212 million in total spend in fiscal year 2021–22 from 22 unique strategic suppliers. Within that spend, the University found that 39% of appliances and IT hardware, 94.5% of indoor office furniture, 65% of cleaning supplies and 37.6% of office supplies met UC’s requirements on minimum or preferred green spend, as outlined in the Sustainable Procurement Guidelines. The University looks forward to improving its data collection processes in future years. Analysis of UC’s support of small businesses, presented to the state each year, can be found online.
UC Code of Conduct for Trademark Licensees
An uneven global pandemic recovery increased pressures upon workers and communities that manufacture UC campus trademark licensed–products in fiscal year 2021–22. Supply chain disruptions, COVID-19 variants, vaccination delays, supply and demand imbalances, and skyrocketing inflation-driven costs increased the workplace and human rights challenges for workers. Compounding this were ongoing concerns about forced labor in China and widespread impact of nonpayment of rising legally mandated wages and benefits in key countries of production such as Haiti, India and Pakistan.
The Code of Conduct for Trademark Licensees Steering Committee addressed the following areas of concern regarding social and environmental sustainability during fiscal year 2021–22:
- The widespread growth of non-fungible token proposals for collegiate sports content and name, image and likeness rights of student athletes.
- The growing regulatory responses to ongoing reports of forced labor of Muslim minority residents of the Xinjiang province of western China, including the Uyghur Forced Labor Prevention Act, a sweeping bipartisan law signed by President Biden and in force since mid-June 2022.
- Consideration of UC support for the future of the International (formerly Bangladesh) Accord for Health and Safety in the Textile and Garment Industry, which is being expanded to new source countries in South Asia.
- Ongoing support for the work of the nonprofit Fair Labor Association and Worker Rights Consortium.
The impact of the University of California’s licensed product manufacturing extends to 49 countries where 3,400 disclosed suppliers manufacture for 338 licensee companies that have permission to use university trademarks on products that are sold to the public.
Sustainable Building Operations and Laboratories
total assessed green laboratories
All campuses have completed at least three assessments through their Green Labs assessment programs. By the end of fiscal year 2021–22, the cumulative number of laboratories certified as green by campuses totalled 329. This number represents a small decrease — 5 percentage points — from the previous year. Systemwide, Green Lab certifications slowed down because of staff density restrictions in research labs as a result of the COVID-19 pandemic, and some Green Labs programs were put on pause. However, campuses collectively reported that they directly engaged more than double the number of researchers in sustainability efforts compared to the previous fiscal year, close to 2,300 researchers. In the upcoming year, campuses are excited to partner with life sciences suppliers to provide $10,000 in rebate incentives for lab equipment that is energy- or water-efficient.
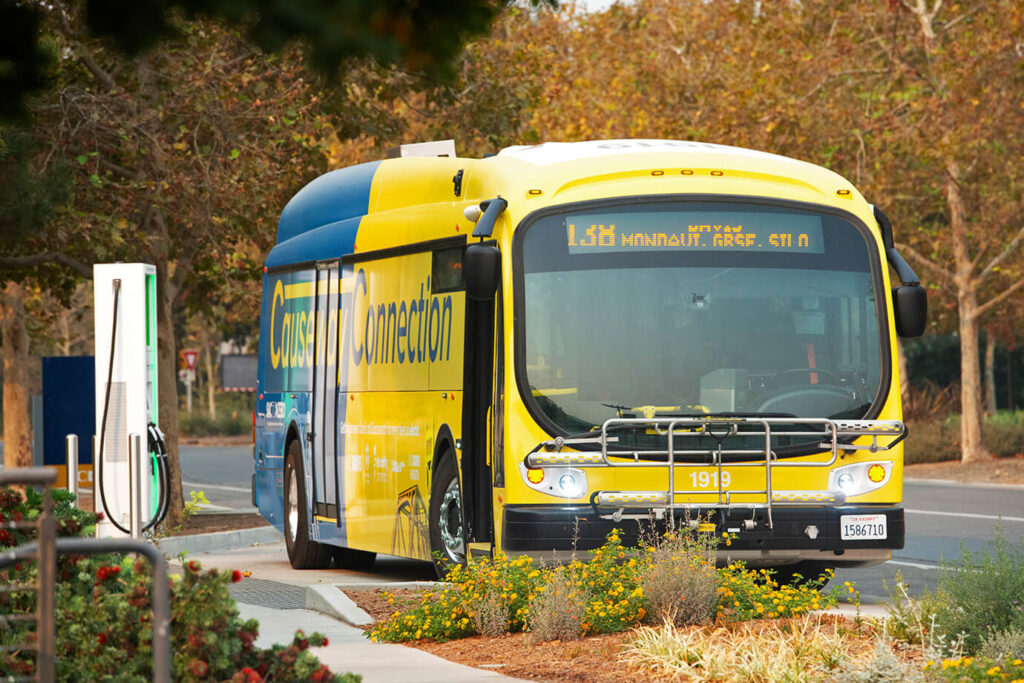
Transportation

EV charging ports

of light-duty vehicles acquired in fiscal year 2021–22 were electric (zero-emission) or hybrid vehicles
Systemwide, 53% of all new light-duty fleet vehicles purchased in fiscal year 2021–22 were battery-electric, plug-in hybrid or gasoline-electric hybrid vehicles, helping to move fleet emissions closer to carbon neutrality. Over 1,600 active electric vehicle charging stations, and many more EV-ready locations, support the conversion of fleet and commute vehicles to electric options. In spring 2022, the University adopted new policy requirements that all sedans and passenger minivans acquired be battery electric or plug-in hybrid or utilize an equivalent clean transportation fuel. Additionally, 50% of all vehicles (including medium-duty and heavy-duty vehicles) acquired after July 2023 must meet the same requirements.
In fiscal year 2021–22, a majority of locations reported notable decreases in single-occupancy-vehicle commuting from their 2015 baseline rates. Similarly, most locations continue to report significant increases in telecommuting rates compared to pre-pandemic levels (especially among staff and, to a lesser extent, students). However, many locations did see an increase in single-occupancy-vehicle commute rates from the previous year, reflecting the return to pre-pandemic activities at most campuses.
UC Health
Recognizing the unique challenges and opportunities for implementing sustainable practices in health care facilities, the University of California updated its Sustainable Practices Policy in 2018 to add a section devoted to sustainability in its health operations.
In 2022, the University launched a new systemwide UC Center for Climate, Health and Equity, which aims to harness the expertise and leadership of the health sector to drive ambitious climate action that prioritizes the health, equity and respect of all communities. The University also joined two national efforts for climate action in the health care sector. The University signed the White House’s Health Care Sector Climate Pledge, promising to take additional climate action by assessing supply chain emissions and developing climate resilience plans for UC’s health facilities and communities. The University also was accepted as a network organization in the National Academy of Medicine’s Action Collaborative focused on decarbonizing the U.S. health sector. Demonstrating its leadership in climate action, UC has two new all-electric medical facilities that have been approved for construction, one at UC Irvine Health and another at UCSF Health.
UC’s hospitals were recognized for their climate change achievements in the Health Care Climate Challenge and with Practice Greenhealth, the industry body for sustainability in health care.
Seeking to expand its sustainability leadership into supply chain management, in 2022 the academic health centers developed proposed policy goals to scale up existing efforts around reprocessing single-use devices. The academic health centers also developed proposed goals around procurement of electronics and office supplies
Finally, on the waste front, the health systems produced, on average, 26.6 pounds of waste per adjusted patient day in fiscal year 2021–22 , a reduction of over 4.5 pounds per adjusted patient day from the previous fiscal year.
Water
*Based on a 3-year average of fiscal years 2005-08.
Calculations exclude ANR, UCDH, UCIH, and UCSFH.
In fiscal year 2021–22, UC campuses resumed in-person instruction and residential occupancy. All UC locations also settled into what may become the new normal for operations, with hybrid and flex work schedules for staff and faculty. Despite fluctuations in numbers of people on-site, the University continued to use water to support agriculture, landscape irrigation, research and utility generation.
UC’s overall potable water use decreased from pre-pandemic levels, from over 4.1 billion gallons in fiscal year 2018–19 to 3.84 billion gallons in fiscal year 2021–22, a savings of close to 300 million gallons systemwide. Six UC locations exceeded their 2025 goal of a 36% reduction in potable water use per person.
Given the severity of the current drought in California, UC campuses and academic health centers are continuing to identify opportunities for additional reductions and share best practices across the University.
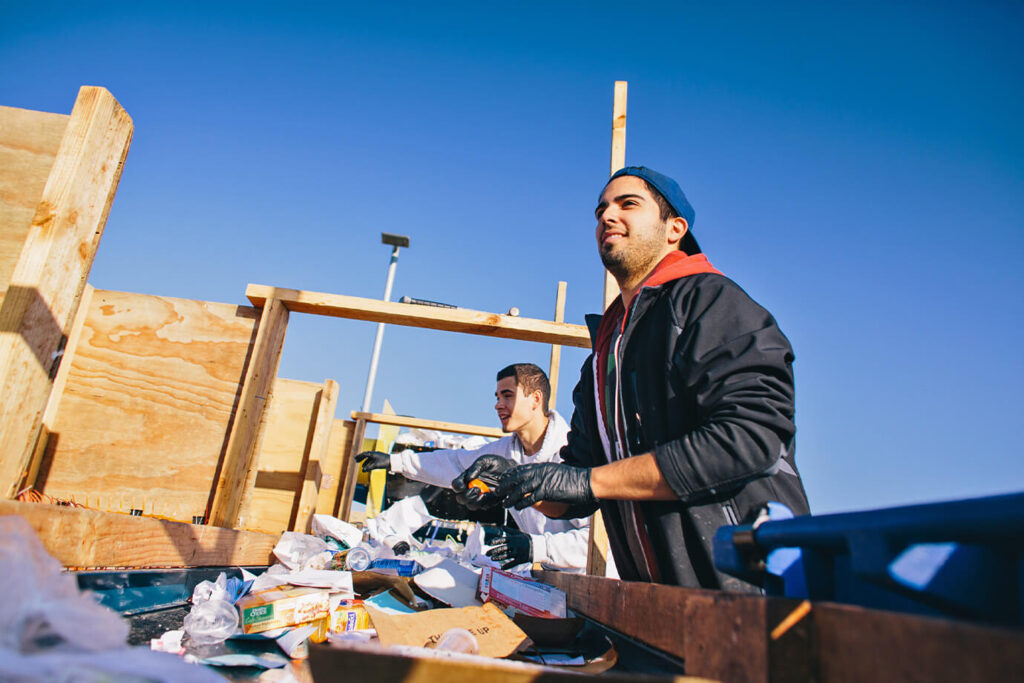
Zero Waste
Despite the ongoing pandemic, campuses have adapted operations while still striving for sustainable outcomes. The majority of campuses held their diversion rates constant, with three campuses demonstrating notable improvements. In fiscal year 2021–22, the University as a whole diverted 70% of its municipal solid waste and construction and demolition wastes from being sent to landfills.
With people returning to campuses in the 2021–22 fiscal year, per capita waste generation returned to pre-pandemic levels. The previous fiscal year’s (2020–21) increase in per capita waste generation likely reflects how many waste-generating processes (landscaping, lab experiments and building maintenance) continue independently from the number of people on campus and also was a result of the increased use of disposable items during the height of the pandemic.
Last year, the University focused on single-use plastics policy implementation, organics diversion and food waste recovery, reporting and data improvements, and sustainable commencement best practices.