Climate mitigation and resilience work continued across UCSF through staff and faculty leadership as well as student-led outreach.
The Academic Senate Committee on Sustainability led the Academic Senate to support various faculty emissions reduction projects. The UC Center for Climate Health and Equity, led by UCSF, received chancellor funding that supports, among other things, monthly Climate Grand Rounds open to the 10 campuses and the public.
UCSF’s first medical director of sustainability led clinical faculty and staff to support sustainability projects around waste and energy. Those groups include Green Radiology, a UC-wide collaboration of radiologists interested in reducing emissions and waste. UCSF radiologists and the Office of Sustainability measured energy from medical imaging devices and intend to use the data to develop Energy Star ratings and find operational energy saving.
The Climate Change and Mental Health Task Force meets to share information with national peers about the mental health impacts of climate change. The Human Health and Climate Change student group produced Wildfires & Our Health educational infographics, and Green Teeth, a group of dental students, mobilized to identify energy and waste reductions in their school.
Medical students created Interview Without Harm. The UCSF Climate Resilience workshop planned annual engagement and partnerships with relevant community groups. The Student Food Market offers weekly free fresh produce and healthy staples to food-insecure students. UCSF partnered with UC Davis and Stanford to host the second annual Norcal Symposium on Climate Change and Health Equity featuring Chancellor Hawgood.
Stories

Launch of the University of California Center for Climate, Health and Equity
The University of California Center for Climate, Health and Equity, housed at UCSF, aims to harness the expertise and leadership of the health sector to drive ambitious climate action that prioritizes the health, equity and respect of all communities.
CLIMATE PROTECTION – EMISSIONS
2021 data will be finalized after verification by a third party by early 2023.
The response to the pandemic continues to affect on-site UCSF activities with over a third remote workers, yet buildings continue to operate with full HVAC systems. Energy efficiency projects are continuing. UCSF saw a slight decrease in electricity usage and an increase in natural gas usage, with an overall increase in energy use of 1%. We also saw a marked emissions reduction in business travel but an increase in commuter emissions of 6%, which is attributed to the reluctance to use public transit or carpool/vanpool. There was a 96% reduction in scope 2 emissions by moving from bundled PG&E to UC Clean Power. Overall emissions from 2020 were reduced by 3%, which was driven primarily by the scope 2 changes.
ENERGY – RENEWABLE energy use
ENERGY USE INTENSITY (EUI)
UCSF saw a decrease in its EUI in the calendar year 2021.
FOOD

of food and beverage purchases met sustainability criteria ($651K)
of food and beverage purchases were plant-based ($405K)
Retail food services have not yet regained the business lost during the pandemic.
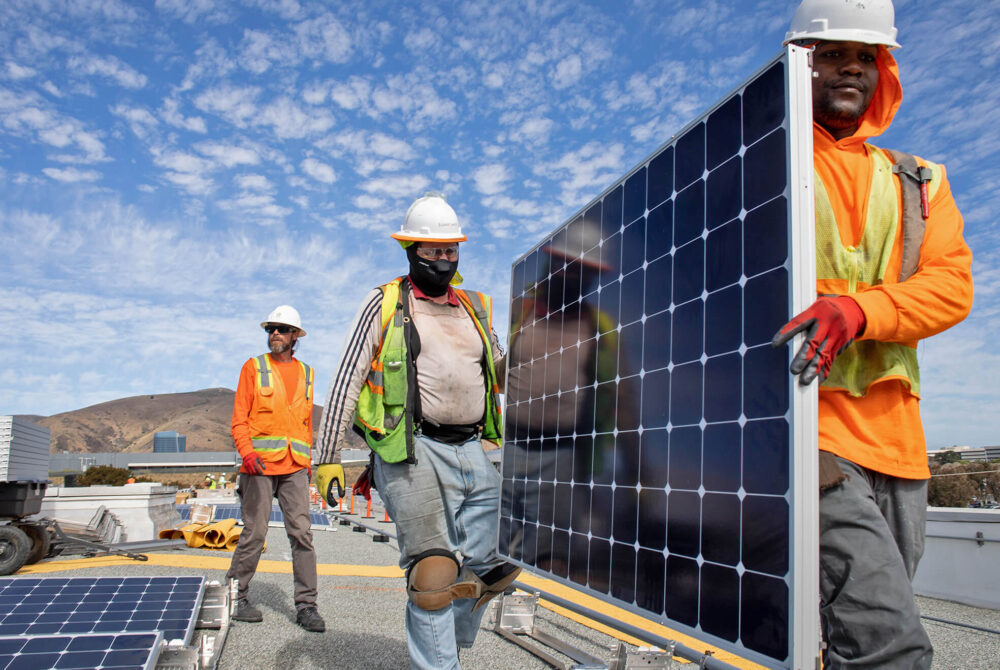
Green building
Five new buildings were being planned or under construction this fiscal year. One hundred percent clean energy from the San Francisco Public Utilities Commission will be used to power three buildings adjacent to a SFPUC power line: a surgery center/clinic and parking structure at the Mission Bay Campus, and a laboratory research building at the County Hospital. The other two buildings are a laboratory research building and a replacement hospital at the Parnassus Heights campus.
18 Gold, 6 Silver and 5 Certified
Total number of LEED certifications
procurement

green spend on electronics (30%)

green spend on cleaning supplies (60%)

green spend on indoor office furniture (99%)
The University resumed reporting on green spend, as defined in the Sustainable Procurement Guidelines, in fiscal year 2021–22 and reached out to suppliers for spend data in four product categories for this year’s report.
Green spend is defined as meeting preferred or minimum criteria in UC’s Sustainable Procurement Guidelines.
Suppliers reporting: Electronics (5), Furniture (3), Cleaning supplies (5), Office supplies (2).
UC Systemwide Spend Analytics category data provided by CalUSource.
Sustainable Building & Laboratory Operations
Twenty-five ultra-low-temperature freezers were identified to be replaced through a freezer rebate program.
total assessed green laboratories
Transportation

of students and employees are utilizing alternative commuting methods

EV charging ports

of light-duty vehicles acquired in fiscal year 2021–22 were electric (zero-emission) or hybrid vehicles
While the UCSF community has largely returned to campus, current commute trends show hybrid work schedules remain strong. When people travel to campus, driving alone remains a preferred method regardless of high gas prices and increasing bridge toll and parking costs. A reluctance to use shuttles and public transit remains although service levels are at almost pre-pandemic levels.
WATER
*Based on a 3-year average of fiscal years 2005-08.
Water consumption was reduced due to irrigation reductions, lab faucet efficiency retrofits, elimination of building and sidewalk washing and a drought outreach campaign. The campus is on track to meet the 2025 goal.
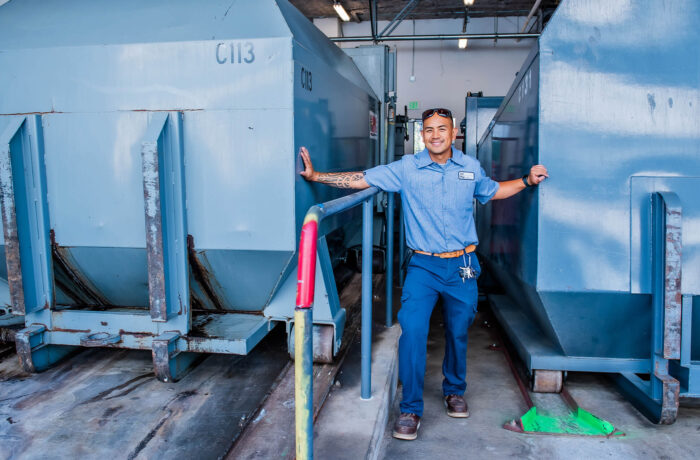
ZERO WASTE – GENERATion
*These numbers might include a small amount of incineration that is being phased out.
Waste generation is almost at pre-pandemic levels. Recycle and compost numbers have increased from last year as people have returned to campus. Landfill numbers are much the same as last year, which is expected since many of our labs have been in operation throughout the pandemic.
ZERO WASTE – DIVERsion
Diversion was estimated to take a bigger hit for the campus at the start of the fiscal year so projects and pilots to mitigate that were expedited. By the end of the fiscal year, the landfill numbers stayed relatively the same and recycle and reuse numbers were high for the pandemic. Even though the municipal solid waste diversion rate dropped to 75%, UCSF should be in a good position to bounce back in the coming fiscal year.
Awards
A full list of awards is featured on the UC Office of the President’s website.