The Campus Advisory Committee on Sustainability began planning for a Fossil Fuel–Free UC Davis, strategizing the elimination of fossil fuel use in operations and building off decarbonization work already underway through the Big Shift project that will transition campus from steam heating. The plan also considers resilience, climate justice, habitat health and risk management.
UC Davis Global Affairs, Sustainability, and the Diversity, Equity, and Inclusion office published the inaugural UC Davis Voluntary University Review (VUR) on the U.N. Sustainable Development Goals in fall 2021. The VUR comprehensively documents the campus’s work across each of the 17 goals in teaching, research, service and operations, and is the first from the UC system and the second known in the nation.
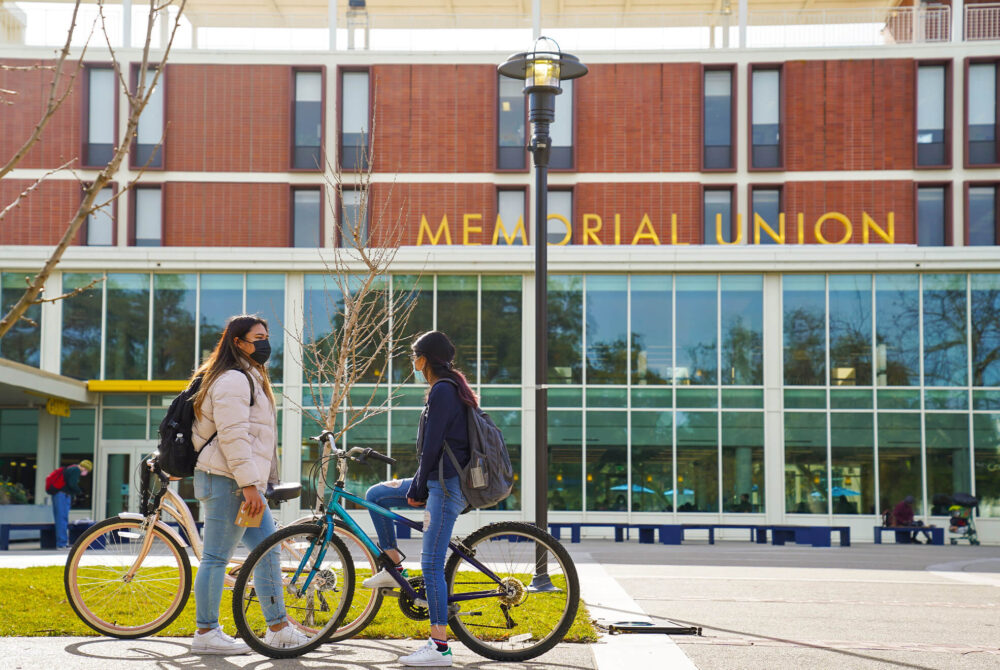
Campus operations advanced sustainability work while managing COVID-19 impacts. TGIF-funded sheepmowers helped maintain the landscape. The first six electric Unitrans buses arrived ready to begin service, and the campus renewed its Bicycle Friendly platinum status. Campus engineers created a user-friendly interface to optimize cooling system operations. And the Coffee House, thought to be the nation’s largest student-run restaurant, resumed Rooftop Garden operations to provide campus-grown produce to its kitchen and eventually to the student Basic Needs Center.
The UC Davis Sustainability Summit, in person for the first time since 2019, welcomed keynote speaker Leah Thomas, climate activist and founder of Intersectional Environmentalist. Two UC Davis Climate Action Fellows interviewed Thomas about her perspectives on environmental justice, and Chancellor May presented the annual Sustainability Champion awards.
Stories
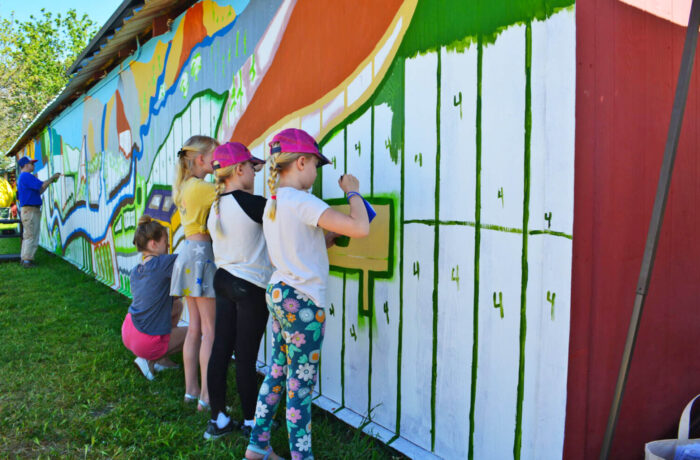

Winning Mural for UC Davis Climate Raising Challenge Painted on Local Barn
The UC Davis Institute of the Environment and the One Climate Initiative partnered with Sustainability to launch a mural design competition open to undergraduates and graduate students identifying a climate-related agricultural issue in the Central Valley. The winning mural, “Hungry for Connection,” created by Rachael Dal Porto, was awarded a prize and painted on the side of a local barn with the help of local muralist Leon Willis and members of the public.
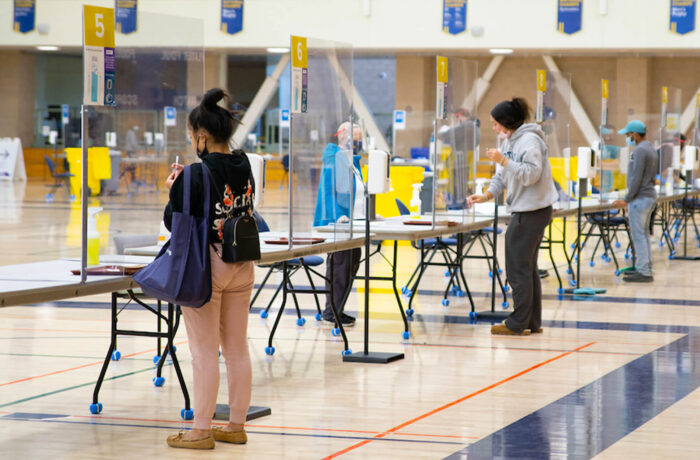
Two Studies Show Healthy Davis Together Prevented Infections, Hospitalizations and Deaths
Two recent studies found that the Healthy Davis Together program, a partnership between UC Davis and the city of Davis that ran for over 21 months beginning in September 2020 to restrict the spread of COVID-19, reduced the caseload in Davis by 60%. This led to a reduction in hospitalizations and deaths, and saved the community millions in retained wages and averted health care costs.
CLIMATE PROTECTION – EMISSIONS
2021 data will be finalized after verification by a third party by early 2023.
As the campus returned to more in-person activity, behavior-based emissions rose to closer to pre-pandemic levels, although air travel emissions remained considerably lower than pre-pandemic. In addition, the campus purchased or swapped fewer renewable energy certificates than in recent years, contributing to an increase in scope 2 emissions. The campus is preparing a Fossil Fuel-Free Pathway Plan, which will demonstrate a path to eliminating most fossil fuel use in operations and offer policy ideas for tackling behavior-based emissions related to commuting and business travel.
ENERGY – RENEWABLE Energy Use
ENERGY USE INTENSITY (EUI)
UC Davis saw a decrease in its EUI in the calendar year 2021.
FOOD
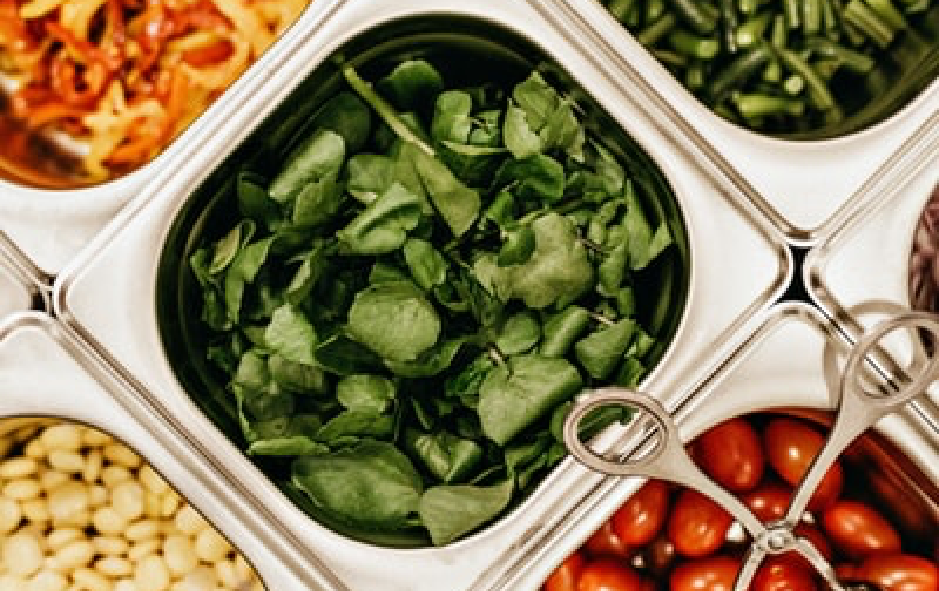
of food and beverage purchases met sustainability criteria ($1.4M)
of food and beverage purchases were plant-based ($4.7M)
UC Davis total food and beverage spend increased by $10 million over the previous year, reaching pre-pandemic levels, as the campus community began to return to in-person activities. UC Davis sustainable food and beverage spend decreased to 10.22%, a 2% change from pre-pandemic levels, due to operations recovering from COVID-19 impacts, such as supply chain shortages and a focus on meeting the increased service demand in the face of significant staffing challenges.
Green building
UC Davis and UC Davis Health are making consistent strides in increasing the number of LEED certified buildings on campus and in the health system. The campus and health system constructed two new LEED buildings and earned one Gold certification for an existing building, totaling three LEED certifications in fiscal year 2021–22. Since 2007, UC Davis and UC Davis Health have certified 28 newly constructed buildings, 11 interior renovation projects, and 13 existing buildings for a total of 52 LEED certifications on the main and health campuses. The campus and health system have eight occupied all-electric buildings, and four are under construction.
10 Platinum, 26 Gold, 8 Silver and 1 Certified
Total number of LEED certifications
procurement

green spend on electronics (39%)
green spend on cleaning supplies (71%)

green spend on indoor office furniture (99%)
The University resumed reporting on green spend, as defined in the Sustainable Procurement Guidelines, in fiscal year 2021–22 and reached out to suppliers for spend data in four product categories for this year’s report.
Green spend is defined as meeting preferred or minimum criteria in UC’s Sustainable Procurement Guidelines.
Suppliers reporting: Electronics (6), Furniture (4), Cleaning supplies (3), Office supplies (1).
UC Systemwide Spend Analytics category data provided by CalUSource.
Sustainable Building & Laboratory Operations
UC Davis assessed four new labs in fiscal year 2021–22. The lab assessment program was redesigned in 2019–20, prompting the campus to start a fresh count of assessed labs this reporting period; since then 12 labs have participated. UC Davis saw an increase in autoclaves still on single-pass cooling and autoclaves using water efficiency measures compared to fiscal year 2020–21 due to a more accurate inventory of autoclaves conducted by Facilities Management and an Energy Systems graduate student as part of an autoclave water-saving project.
total assessed green laboratories
Transportation
of students and employees are utilizing alternative commuting methods

EV charging ports
of light-duty vehicles acquired in fiscal year 2021–22 were electric (zero-emission) or hybrid vehicles
The campus 2021 travel survey shows over 37% of employees and 1% of students telecommuted on average, demonstrating a return to more in-person activity at the campus from the 2020–21 pandemic response year. The campus held remote instruction for the first four weeks of winter quarter, which is not reflected in survey results, since the survey is conducted in the fall. Unitrans ridership was half of pre-pandemic levels. UC Davis’ return to in-person activities during 2021–22 showed a 1.4% increase over the 2015 baseline in single-occupancy-vehicle (SOV) commuting, though SOV commutes remain about 25% of the overall mode split.
WATER
*Based on a 3-year average of fiscal years 2005-08.
UC Davis potable water use increased by 98 million gallons, a 12% increase per capita compared to fiscal year 2020–21. The increase in water use was largely for potable water in buildings. UC Davis is still on track to meet the 2025 water reduction target despite an upward trend in potable water use from 2019–22.
ZERO WASTE – GENERATION
*These numbers might include a small amount of incineration that is being phased out.
The overall municipal solid waste (excluding construction and demolition) generated at UC Davis in fiscal year 2021–22 increased by almost 3,000 tons, a 19% increase from fiscal year 2020–21. This year more of the campus returned to in-person activities and continued to use a number of single-use and disposable items during ongoing the COVID-19 response. Compared to pre-pandemic levels, overall municipal solid waste (excluding construction and demolition) was reduced by over 1,500 tons, an 8% decrease from in waste generated in fiscal year 2019–20.
Comparing waste generated per capita to previous years’ per capita figures shows that landfill produced per person is higher than pre-pandemic levels and recycling and organic waste per person is lower.
ZERO WASTE – DIVERSION
UC Davis diverted over 12,000 tons, or 65% of its waste (excluding construction and demolition), in fiscal year 2021–22, a diversion rate that is 5% lower compared to fiscal year 2020–21.
Awards
UC Davis maintains a Gold rating from the Association for the Advancement of Sustainability in Higher Education’s Sustainability Tracking, Assessment and Rating System (AASHE STARS). The report is valid until 2023. The campus conducted a STARS gap analysis this past year and plans to submit an updated STARS report in 2023. This rating system assesses the broad spectrum of sustainability initiatives and programs across campus, with sections covering academics, engagement, operations and public administration. A full list of awards is featured on the UC Office of the President’s website.