In 2022, UC Merced successfully achieved an Association for the Advancement of Sustainability in Higher Education’s Sustainability Tracking, Assessment and Rating System (AASHE STARS) Platinum rating for its environmental performance.
UC Merced was also highlighted in the 2022 Sustainable Campus Index SCI for the Pop-up People’s Pantry. The pantry partners with UC Merced’s Bobcat Eats Food Waste Awareness and Prevention Program and the 18th Street People’s Garden. The Pop-Up People’s Pantry is unique compared to typical campus food pantries because it targets both students and community members in helping to reduce food insecurity and food waste in the Merced community.
UC Merced made the following rankings: Princeton Review’s Top 50 Green Colleges for 2022, Sierra Club’s Top 20 Coolest Schools 2021 and EcoWatch’s Greenest College Campuses in the U.S. for 2022.
Stories


Campus Awarded Edible Food Recovery Grant
UC Merced’s Office of Sustainability’s Bobcat Eats Food Waste Awareness and Prevention Program, in partnership with United Way of Merced, Community Initiatives 4 Collective Impact and the 18th Street People’s Garden, has been awarded a $250,000 grant from the Department of Resources Recycling and Recovery (CalRecycle).
CLIMATE PROTECTION – EMISSIONS
2021 data will be finalized after verification by a third party by early 2023.
UC Merced had set an aggressive goal to achieve climate neutrality for scopes 1 and 2 sources by 2020. In 2021, UC Merced operations ramped up with a return to in-person instruction. The campus is assessing its energy performance with the onset of increased building occupancy. Scope 3 emissions are estimated and will be refined as additional information is gathered to provide a full spectrum of campus behavior.
ENERGY – RENEWABLE energy use
ENERGY USE INTENSITY (EUI)
UC Merced saw an increase in its EUI in the calendar year 2021.
FOOD

of food and beverage purchases met sustainability criteria ($1.3M)
of food and beverage purchases were plant-based ($1.3M)
Dining services had limited offerings due to COVID-19 restrictions. Invoices could not be retrieved from two vendors, so both were assumed to be neither plant-based nor sustainable.
Green building
19 Platinum, 10 Gold and 2 Silver
Total number of LEED certifications
procurement

green spend on electronics (50%)

green spend on cleaning supplies (93%)

green spend on indoor office furniture (99%)
The University resumed reporting on green spend, as defined in the Sustainable Procurement Guidelines, in fiscal year 2021–22 and reached out to suppliers for spend data in four product categories for this year’s report.
Green spend is defined as meeting preferred or minimum criteria in UC’s Sustainable Procurement Guidelines.
Suppliers reporting: Electronics (4), Furniture (1), Cleaning supplies (2), Office supplies (0).
UC Systemwide Spend Analytics category data provided by CalUSource.
Sustainable Building & Laboratory Operations
No labs were certified this year because of COVID-19.
total assessed green laboratories
Transportation

of students and employees are utilizing alternative commuting methods

EV charging ports
UC Merced experienced a decrease in commute emissions due to the COVID-19 restrictions and transition to remote work.
WATER
*Based on a 3-year average of fiscal years 2005-08.
Overall water use increased from the previous two years due to additional buildings coming online from the 2020 project, UC Merced’s expansion program.
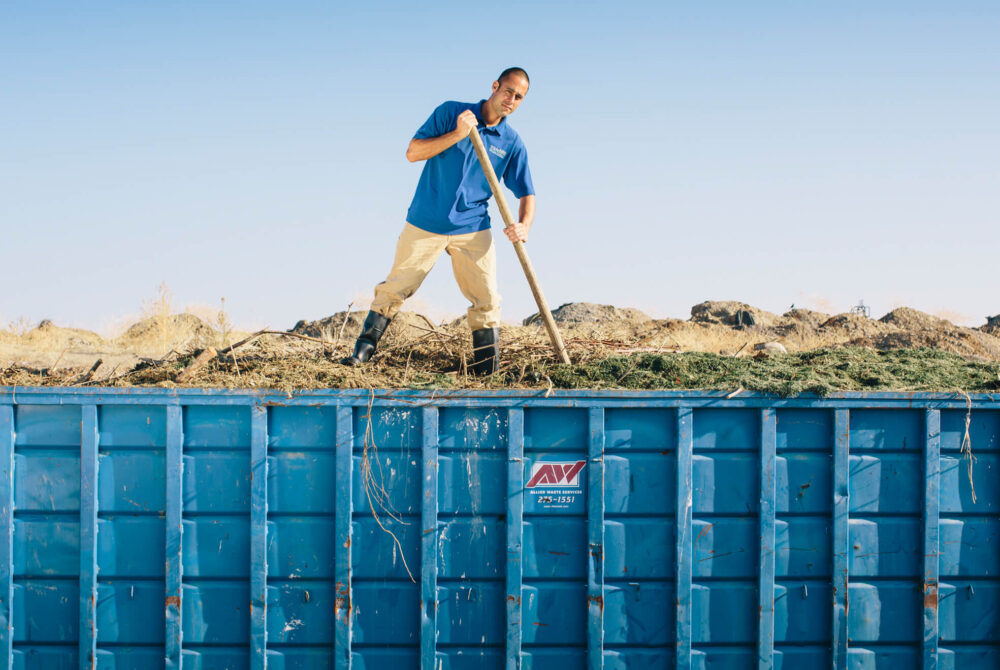
ZERO WASTE – GENERATion
*These numbers might include a small amount of incineration that is being phased out.
Overall municipal solid waste (excluding construction and demolition) increased 82% over last year, most likely due to the return to campus and events.
ZERO WASTE – DIVERsion
UC Merced reported limited waste data in 2019.
The diversion rate decreased by approximately 3% due to an increase in campus population after the previous year’s pandemic-related curtailment.
Awards
UC Merced achieved an Association for the Advancement of Sustainability in Higher Education’s Sustainability Tracking, Assessment and Rating System (AASHE STARS) Platinum rating in 2022. This rating system assesses the broad spectrum of sustainability initiatives and programs across campus, with sections covering academics, engagement, operations and public administration. A full list of awards is featured on the UC Office of the President’s website.