Lawrence Berkeley National Laboratory (Berkeley Lab) is a Department of Energy (DOE) Office of Science research laboratory operated by the University of California. Sustainability performance highlights from the last year include:
Maintained energy savings: The Lab maintains a portfolio of energy and water savings that currently generate an annual reduction in utility bills of over $1 million, driven primarily by a dedicated ongoing commissioning team. The team, which comprises staff from Sustainable Berkeley Lab and Facilities Management, won a 2021 DOE Sustainability Award for Strategic Partnerships.
Measured energy savings: The Lab’s total weather-corrected non-process energy use intensity as of April 2022 is 30% lower than in 2015. Fossil gas consumption across the Lab is down 34%.
Green house gas emissions: Total reported greenhouse gas emissions as of October 2021 are 60% below 2015 levels.
ISO 50001: The Lab received two awards in the last year, from DOE and the international Clean Energy Ministerial, for its best-in-class energy and water management program, which is certified to the international energy management standard, ISO 50001.
Net-zero planning: Within the past year, the Lab has initiated comprehensive net-zero planning efforts to meet a new presidential executive order requiring full decarbonization across all reported greenhouse gas emissions no later than 2045.
The Lab is seeing some increase in energy and water consumption associated with mission-specific process loads, yet these increases are offset in part by continued efficiency improvements and lower on-site populations than prior to COVID-19, which also reduce the generation of nonhazardous waste. Explore trends at sbldata.lbl.gov.
Stories
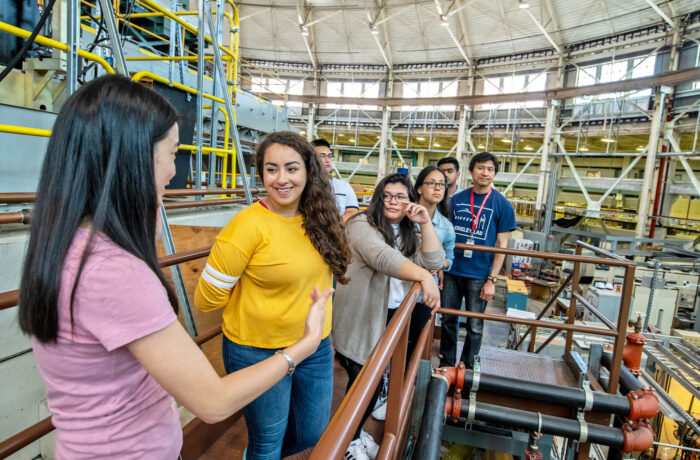

Supporting the Next Generation of Climate Champions
Berkeley Lab is committed to helping train the next generation of scientists and engineers, and builds strong partnerships with community-based organizations like the Rising Sun Center for Opportunity to accomplish that goal.
CLIMATE PROTECTION – EMISSIONS
2021 data will be finalized after verification by a third party by early 2023.
Berkeley Lab reduced its greenhouse gas emissions for federal fiscal year 2021 (the 12 months through September 2021) by 60% from a fiscal year 2015 baseline. Some reductions are attributable to significant energy efficiency achievements. The energy consumption per square foot of the Lab’s general building stock as of the end of fiscal year 2021 is 29% below 2015 levels. Natural gas efficiency improvements are deeper: The Lab’s sitewide natural gas consumption per square foot is 37% below 2015 levels. As well, scope 3 emissions remain at much lower levels than before the COVID-19 pandemic.
ENERGY USE INTENSITY (EUI)
The Lab saw a decrease in its EUI in the calendar year 2021.
Green building
Berkeley Lab’s Integrative Genomics Building (IGB) received LEED Gold certification under v2009 for New Construction in 2020, achieving 68 points. This building replaces the previously leased Joint Genome Institute facility in Walnut Creek that Berkeley Lab vacated in January 2020. IGB uses no natural gas for space and water heating. In operation, IGB is meeting its design target for deep energy efficiency: 102 kBtu/sf-yr (weather corrected), or 33% of the UC building energy benchmark, as of March 2022. A new laboratory building, called BioEpic, is under construction that is targeting LEED Gold and uses no natural gas for space and water heating.
1 Platinum and 6 Gold
Total number of LEED certifications
Transportation

EV charging ports

of light-duty vehicles acquired in fiscal year 2021–22 were electric (zero-emission) or hybrid vehicles
Berkeley Lab has approximately 1,700 employee parking spaces on the main hill site, including a total of 30 active employee EV charging locations, 16 of which are Level 2, which operate at 240 volts. The Lab’s EV charging program has a membership of 215 people on average for the reported year with more than 100 regular users. Utilization of the EV charging locations declined during the fiscal year 2020–21 reporting period because of the COVID-19 pandemic but has since peaked in fiscal year 2021–22 as more employees have returned to work on-site. During the reporting period, the Lab leased four light-duty fully electric fleet vehicles and one hybrid electric vehicle.
WATER
*Based on fiscal year 2007-08.
Overall, water consumption at Berkeley Lab has decreased by about 8 million gallons from the previous year’s reporting period. However, water consumed for process cooling by the Lab’s major facilities (high-performance computing and two cyclotrons) increased by more than 2 million gallons compared to the previous year. Berkeley Lab has utilized available population data from human resources for estimating the average weighted campus user (WCU) of the main hill site for UC fiscal year 2021–22. The WCU for this reporting period is 5,121, up by 707 from the previous year. Water consumption intensity is 29.3 gallons per square foot per year compared to 33.5 gallons per square foot per year the previous year.
ZERO WASTE – GENERATION
*These numbers might include a small amount of incineration that is being phased out.
Berkeley Lab had a diversion rate of 68% excluding construction and demolition and a rate of 69% including construction and demolition.
ZERO WASTE – DIVERsion
Berkeley Lab generated 518 tons of waste and diverted 352 tons of waste from building operations. Construction waste increased over last year as there is a new building being built. Total construction waste generated was 121 tons with 86 tons diverted.
Awards
A full list of awards is featured on the UC Office of the President’s website.