This past year, Berkeley made strides to decarbonize the campus energy system and advance a more sustainable and inclusive community.
The Office of Sustainability and Facilities Services have been fundraising and designing for the Berkeley Clean Energy Campus (BCEC) initiative. This project aims to transform Berkeley into a 100% electrified and renewable-energy microgrid and reduce energy carbon emissions by 80% by 2028. The BCEC intends to be a robust living lab. As an example of this, campus researchers drilled a 400-foot borehole on campus to explore the potential of geothermal heating for the future system. Given the state’s interest in a model demonstrating a transition to 100% clean energy on the scale of a medium city, it has allocated $249 million over the next three years to help fund this major transformation.
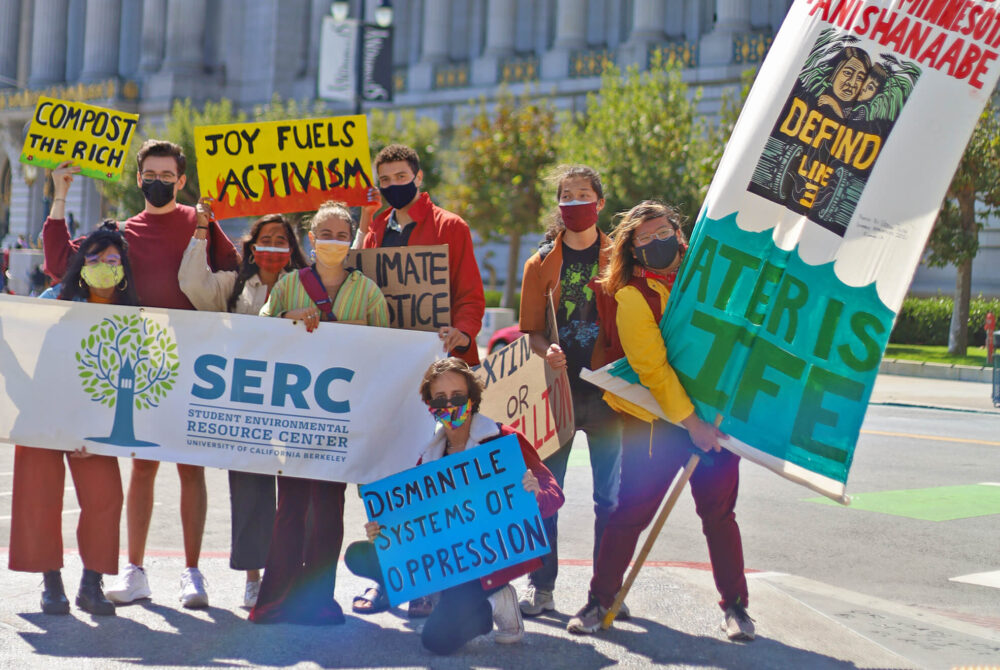
The state also selected Berkeley for a new student service program, College Corps. As a sponsoring unit, the Student Environmental Resource Center will host 40 fellows over the next two years; fellows will receive a $10,000 living stipend and education grant in exchange for 450 hours of public service working with local organizations on projects related to climate and food justice.
The Chancellor’s Advisory Committee on Sustainability (CACS) formed a working group, facilitated by Carbon Neutrality Initiative fellows, to lead a climate change resilience planning process focused on diversity, equity, inclusion and justice. The community celebrated at the CACS Earth Week Summit, in person after a two-year hiatus, and honored faculty, staff and students for an impressive breadth of sustainability learning and action-oriented contributions.
Stories
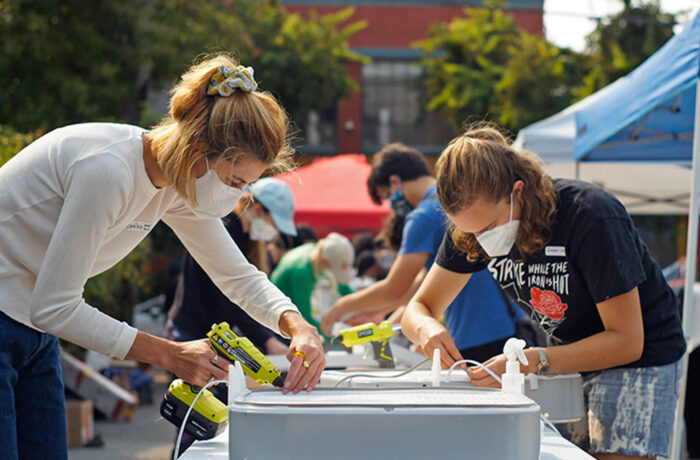

As Wildfire Season Advances, So Does Major DIY Air Purifier Effort
Launched by UC Berkeley graduate student Abrar Abidi and campus research assistant Yvonne Hao, the Common Humanity Collective organized the making and distribution of air purifiers to local low-income residents during wildfire season. Other activities of the collective have included making and distributing hand sanitizer and face masks during the pandemic to people in shelters, jails and nursing homes.
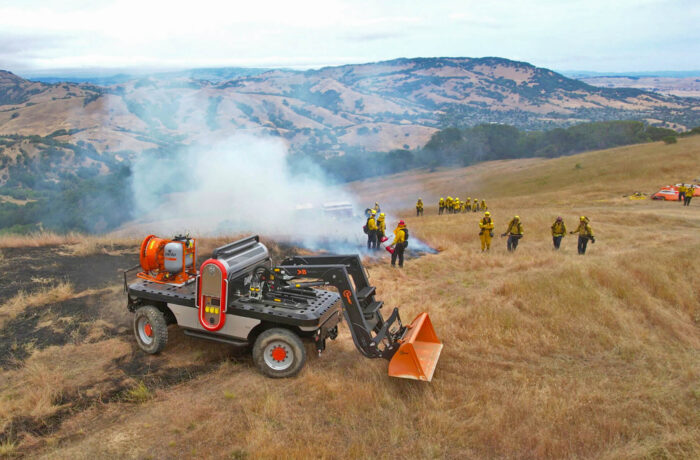
Fired Up for the Future
UC Berkeley’s Disaster Lab has been collaborating with the FIRE Foundry, a program that recruits young adults from underrepresented communities for careers in the fire service, led by the Marin County Fire Department, the College of Marin and the Conservation Corps. Working alongside Berkeley engineers, the FIRE Foundry recruits have been testing mobile energy generators, electric emergency and fire prevention vehicles, and artificial intelligence wildfire detection systems and other innovative tools.
CLIMATE PROTECTION – EMISSIONS
2021 data will be finalized after verification by a third party by early 2023.
UC Berkeley saw a decrease in scope 1 emissions and increase in scope 2 emissions, which can be traced back to a monthlong service-related outage of the cogeneration plant. Scope 3 emissions saw a slight increase as students returned to campus for fall 2021.
ENERGY – RENEWABLE ENERGY USE
ENERGY USE INTENSITY (EUI)
UC Berkeley saw a decrease in its EUI in the calendar year 2021.
FOOD

of food and beverage purchases met sustainability criteria ($3.8M)
of food and beverage purchases were plant-based ($4.3M)
COVID-19 recovery allowed the purchase of more sustainable food. There was a switch to a sustainable beef and pork supplier, and the sustainable chicken and seafood program was maintained.
Green building
UC Berkeley’s Northern Regional Library Facility received LEED Gold certification in 2021.
2 Platinum, 13 Gold, 8 Silver and 1 Certified
Total number of LEED certifications
procurement

green spend on electronics (38%)

green spend on cleaning supplies (69%)

green spend on indoor office furniture (95%)

green spend on office supplies (25%)
The University resumed reporting on green spend, as defined in the Sustainable Procurement Guidelines, in fiscal year 2021–22 and reached out to suppliers for spend data in four product categories for this year’s report.
Green spend is defined as meeting preferred or minimum criteria in UC’s Sustainable Procurement Guidelines.
Suppliers reporting: Electronics (5), Furniture (4), Cleaning supplies (5), Office supplies (3).
UC Systemwide Spend Analytics category data provided by CalUSource.
Sustainable Building & Laboratory Operations
UC Berkeley certified two new labs in spring 2022, conducted five lab-waste audits and collected nine years of purchasing data.
total assessed green laboratories
Transportation

of students and employees are utilizing alternative commuting methods

EV charging ports

of light-duty vehicles acquired in fiscal year 2021–22 were electric (zero-emission) or hybrid vehicles
The 2021 campus commute survey shows 38% of employees and 7.1% of students telecommuted (down from 76% of employees and 90% of students telecommuting in 2020), signaling a return to in-person campus activity and an increase in commute-derived emissions.
WATER
*Based on a 3-year average of fiscal years 2005-08.
Water use remained below pre-pandemic levels but in 2022 rose over 2021, an increase likely related to the return to campus. The campus is on track to meet the 2025 goal.
ZERO WASTE – GENERATION
*These numbers might include a small amount of incineration that is being phased out.
The overall municipal solid waste generated at Berkeley in fiscal year 2021–22 increased from fiscal year 2020-21, which can be ascribed to a return to in-person activities.
ZERO WASTE – DIVERsion
Diversion increased in fiscal year 2021–22. The rise in UC Berkeley’s diversion rate during fiscal year 2018–19 reflects an increase in campus construction projects.
Awards
UC Berkeley has a Platinum Association for the Advancement of Sustainability in Higher Education’s Sustainability Tracking, Assessment and Rating System (AASHE STARS) rating, valid through 2024. This rating system assesses the broad spectrum of sustainability initiatives and programs across campus, with sections covering academics, engagement, operations and public administration. A full list of awards is featured on the UC Office of the President’s website.