Recognized by Forbes magazine this year in the annual college ratings, UC San Diego’s sustainability efforts were singled out, contributing to the campus being ranked 17th overall and third in public institutions.
Increasing the campus community’s awareness of sustainability efforts led to the publication of the UC San Diego Annual Sustainability Report. Resource Management and Planning held its first climate and sustainability town hall, which highlighted past, current and potential future actions to reduce greenhouse gas emissions, including the upgrade of controls at the Main Central Utilities Plant to increase system reliability and robustness.
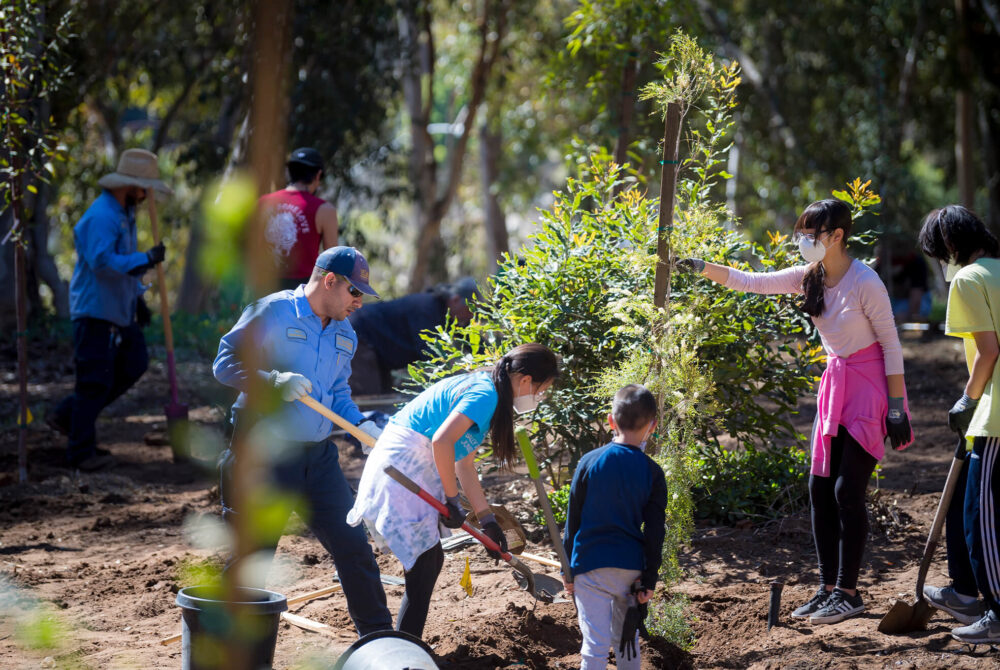
Campus collaborations continued, such as the transformational 10-year strategic partnership with Thermo Fisher Scientific that includes the development of a sustainable supply chain. Also, UC San Diego launched a first-of-its-kind agreement with Ford Mobility companies to deliver and integrate sustainable transportation modes. Landscape Services partnered with CAL FIRE on an AMPlify the Urban Forest grant in an effort to plant 2,000 trees across California in one day. Recreation hosted its first Rec Thrift Pop-up, providing over 500 students with new and gently used athletic apparel.
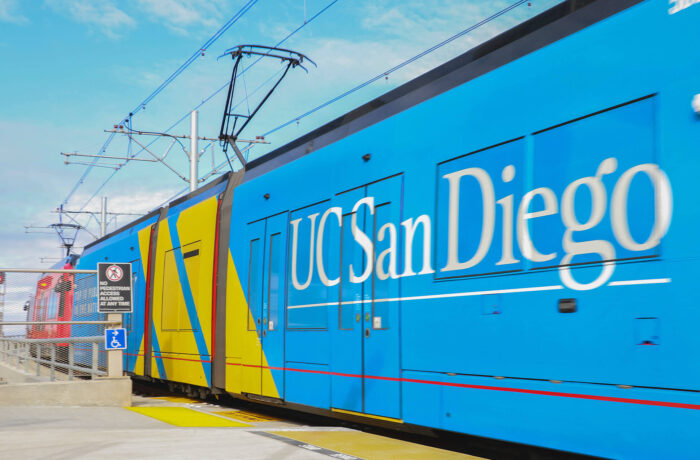
The campus welcomed the Blue Line Trolley extension, providing direct access to campus for those throughout the region. The newly constructed Design and Innovation Building earned LEED Gold certification while the Institute of Geophysics and Planetary Physics Munk Lab received the Preservation Design Award from the California Preservation Foundation. University Center powder-coated 30 sets of outdoor tables and chairs rather than replacing them, diverting waste from the landfill and saving nearly $25,000.
Stories

UC San Diego Partners with County on Framework to Guide Decarbonization of Regional Economy
The County of San Diego announced the development of a science-based approach to decarbonizing the region’s economy called the Regional Decarbonization Framework . Decarbonization is about reducing the gases in the atmosphere that trap heat. The goal is to achieve a balance of the carbon cycle in nature. This will be the nation’s first truly localized effort. It is being crafted with expertise from the UC San Diego School of Global Policy and Strategy and the Energy Policy Initiatives Center at the University of San Diego School of Law. This Framework, directed by the County Board of Supervisors on January 27, 2021, will help guide the region toward zero-carbon emissions.
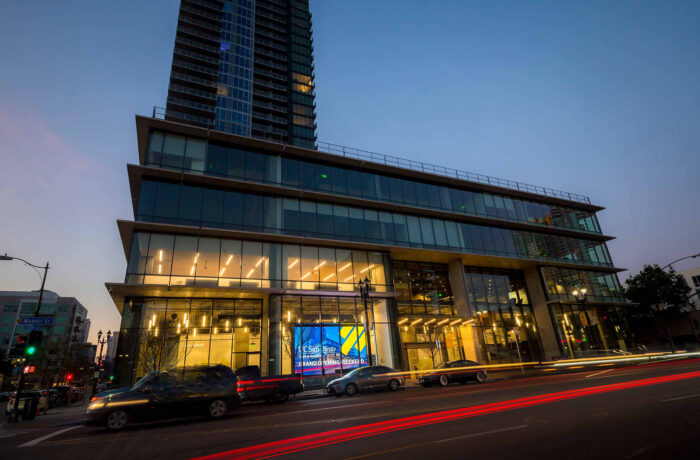
UC San Diego’s New Downtown Hub Park & Market Opens to the Public
Steps away from the Blue Line Trolley connecting UC San Diego’s main campus with the U.S.-Mexico border, UC San Diego Park & Market is designed to serve the entire San Diego community as a social and intellectual hub for civic engagement, learning and collaboration. The flexibly designed space represents the University’s commitment to connecting with the cultural heritage and shared values of the region’s diverse social, cultural and economic community.
CLIMATE PROTECTION – EMISSIONS
2021 data will be finalized after verification by a third party by early 2023.
UC San Diego is not meeting the 2020 greenhouse gas reduction target while evaluating the increased use of offsets to meet policy goals.
ENERGY – RENEWABLE energy use
ENERGY USE INTENSITY (EUI)
UC San Diego saw a decrease in its EUI in the calendar year 2021.
FOOD

of food and beverage purchases met sustainability criteria ($5.6M)
of food and beverage purchases were plant-based ($5M)
In fiscal year 2021–22, the campus experienced pre-pandemic levels of dining operations and retail operations.
Green building
UC San Diego continues to design and construct LEED certified buildings, adding three to the inventory this year.
4 Platinum, 28 Gold, 14 Silver and 3 Certified
Total number of LEED certifications
procurement

green spend on electronics (39%)

green spend on cleaning supplies (71%)

green spend on indoor office furniture (87%)
The University resumed reporting on green spend, as defined in the Sustainable Procurement Guidelines, in fiscal year 2021–22 and reached out to suppliers for spend data in four product categories for this year’s report.
Green spend is defined as meeting preferred or minimum criteria in UC’s Sustainable Procurement Guidelines.
Suppliers reporting: Electronics (9), Furniture (4), Cleaning supplies (2), Office supplies (1).
UC Systemwide Spend Analytics category data provided by CalUSource.
Sustainable Building & Laboratory Operations
The UC San Diego Green Labs program certified four additional labs this year.
total assessed green laboratories
Transportation

of students and employees are utilizing alternative commuting methods

EV charging ports

of light-duty vehicles acquired in fiscal year 2021–22 were electric (zero-emission) or hybrid vehicles
UC San Diego remote work continued to positively affect commute emissions, with an approximate 20% reduction compared to pre-pandemic level in 2019.
WATER
*Based on a 3-year average of fiscal years 2005-08. Calculations include health systems.
UC San Diego’s potable water use returned to pre-pandemic levels with an increase of 18% from fiscal year 2020–21. This increase in overall water consumption resulted from a return to full occupancy in residential housing. However, the campus is on track to meet the 2025 goal.
ZERO WASTE – GENERATion
*These numbers might include a small amount of incineration that is being phased out.
Per capita waste generation returned to pre-COVID-19 total waste generation levels. Campus occupancy and activity returned to pre-pandemic levels.
ZERO WASTE – DIVERsion
*These numbers might include a small amount of incineration.
Waste diversion (not including construction and demolition) decreased by 6% to 42% in fiscal year 2021–22 compared to the previous year. Additionally, total waste generation (including construction and demolition) increased to 48%. Programs such as green waste services and surplus sales had a lower positive impact this year.
Awards
UC San Diego has met the goal and has a Gold Association for the Advancement of Sustainability in Higher Education’s Sustainability Tracking, Assessment and Rating System (AASHE STARS) rating valid through 2024. This rating system assesses the broad spectrum of sustainability initiatives and programs across campus, with sections covering academics, engagement, operations and public administration. A full list of awards is featured on the UC Office of the President’s website.