Fiscal year 2021–22 marked many significant transitions. Much of the year has focused on the shift back to in-person operations with multiple workshops, a campus residence hall competition and extensive outreach efforts
UCSB’s founding director of campus sustainability, Mo Lovegreen, who had led the campus’s sustainability efforts since 2002, retired in June 2022. UCSB appointed Katie Maynard as the new acting director. Ms. Maynard joined UCSB’s Sustainability Program in 2005 and received the UC Systemwide Sustainability Champion Award in 2019.
UC Santa Barbara began construction of the new Interactive Learning Pavilion, which is on track to be the campus’s first major all-electric building. The power supplying the building will be from the campus solar photovoltaic systems as well as from the power supplied by the UC Clean Power, which means the building will be carbon neutral in its operation. It will receive cooling from the campus chilled water loop and will also extract heat from the high-temperature side of the loop using a water-source heat pump. The building’s operational controls will maximize energy efficiency by resetting when classrooms are unoccupied.
In fiscal year 2021–22, the UC Santa Barbara Natural Reserve System directors partnered with the UCSB PACES program to conduct a sustainability assessment of the seven UC Santa Barbara Natural Reserves. The team has developed a list of prioritized projects and a matching list of potential grants that could fund those projects. During the year, the team also submitted a grant to the campus’s Green Initiative Fund and secured an additional grant for electrification of landscaping equipment at Coal Oil Point Reserve.
Stories

Sustainable Transportation Equity Project Grant
UC Santa Barbara is a partner with the Isla Vista Community Services District on a California Air Resources Board–funded project to complete a transportation equity and mobility needs assessment in the Isla Vista region.
CLIMATE PROTECTION – EMISSIONS
2021 data will be finalized after verification by a third party by early 2023.
In 2021, UC Santa Barbara decreased its total greenhouse gas emissions by 19%, about 5,500 metric tons ofCO2e, from 2020. This decrease is largely due to the procurement of clean electricity through the UC Clean Power program and the campus’s continued commitment to energy efficiency and conservation.
ENERGY – RENEWABLE energy use
ENERGY USE INTENSITY (EUI)
UC Santa Barbara saw a decrease in its EUI in the calendar year 2021.
FOOD
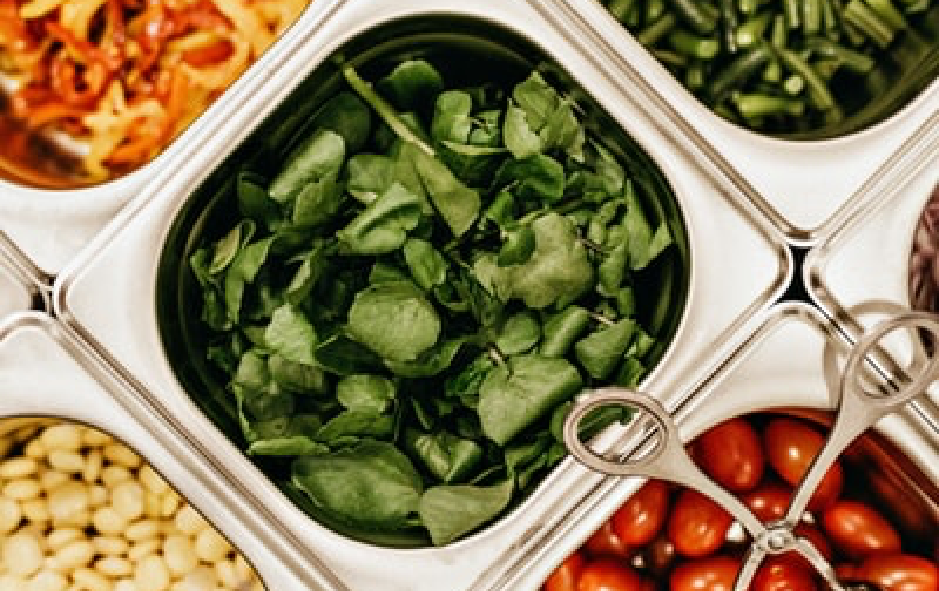
of food and beverage purchases met sustainability criteria ($955K)
of food and beverage purchases were plant-based ($3.5M)
In fiscal year 2021–22, an estimated 10.2% of UC Santa Barbara’s total food and beverage spend was considered sustainable and 37.7% was considered plant based. Due to the review of the plant-based food definition, some items that were previously counted toward the plant base goal have been removed. Additionally, supply chain issues and staffing shortages affected the types of items purchased. The data for this year does not include a full year of operations. Most dining units were not open at full capacity for many months. One of the dining commons (Ortega) was repurposed from an all-you-care-to-eat dine-in facility to a strictly-to-go dining commons.
Green building
UC Santa Barbara continues to increase LEED projects on campus, with all new buildings required to meet a minimum LEED Gold standard. In 2021 San Joaquin Villages earned LEED Neighborhood Development Gold.
14 Platinum, 41 Gold, 15 Silver and 2 Certified
Total number of LEED certifications
procurement

green spend on electronics (61%)
green spend on cleaning supplies (64%)

green spend on indoor office furniture (91%)

green spend on office supplies (57%)
The University resumed reporting on green spend, as defined in the Sustainable Procurement Guidelines, in fiscal year 2021–22 and reached out to suppliers for spend data in four product categories for this year’s report.
Green spend is defined as meeting preferred or minimum criteria in UC’s Sustainable Procurement Guidelines.
Suppliers reporting: Electronics (6), Furniture (2), Cleaning supplies (4), Office supplies (1).
UC Systemwide Spend Analytics category data provided by CalUSource.
Sustainable Building & Laboratory Operations
UC Santa Barbara’s LabRATS program focused on sustainable lab procurement, completing a fume hood assessment and a Health in All Policies analysis of the Green Operations and Labs section of the UC Policy on Sustainable Practices in the 2021–22 academic year. Though the labs were reopened, most were in post-pandemic catch-up mode and were not ready to reopen their labs to focused lab assessments yet.
total assessed green laboratories
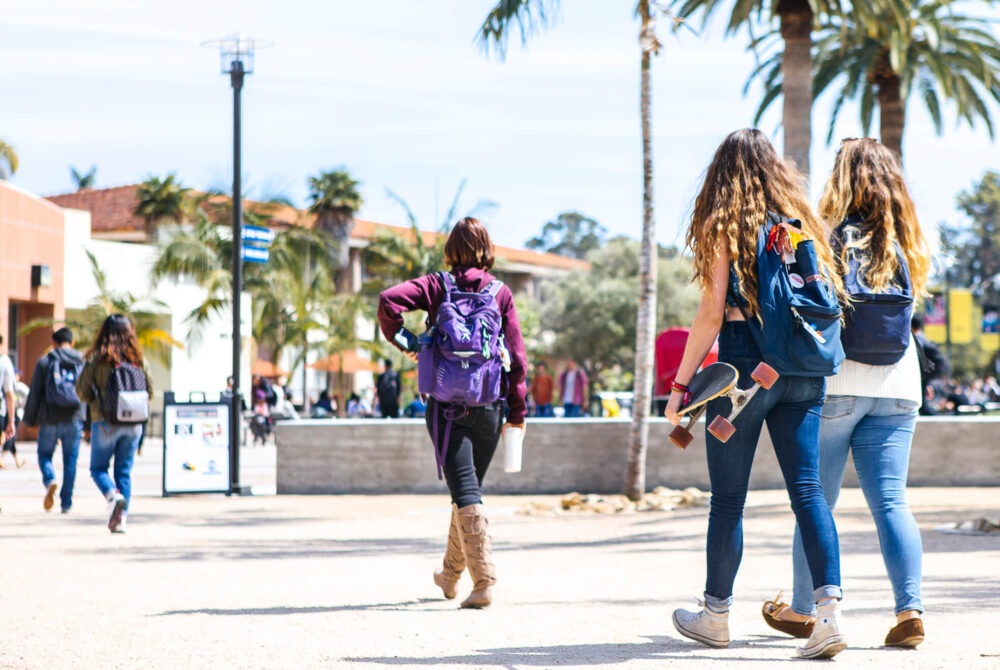
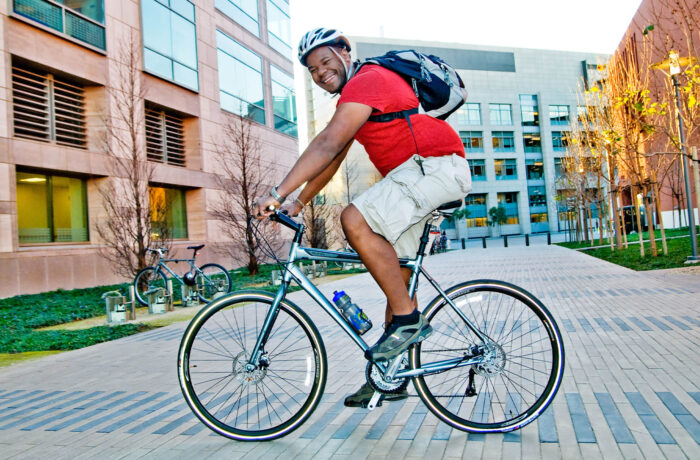
Transportation
of students and employees are utilizing alternative commuting methods

EV charging ports
of light-duty vehicles acquired in fiscal year 2021–22 were electric (zero-emission) or hybrid vehicles
The campus’s spring 2022 commute survey shows 32% of employees and 2% of students telecommuted, up from pre-pandemic levels.
WATER
*Based on a 3-year average of fiscal years 2005-08.
Potable water use increased from last year as students and employees returned after campus curtailment during the pandemic.
ZERO WASTE – GENERATion
*These numbers might include a small amount of incineration that is being phased out.
UC Santa Barbara is now sending organic material to the new County ReSource Center where organics are transformed into compost and energy that powers up to 3,000 homes per year.
ZERO WASTE – DIVERsion
UC Santa Barbara’s waste diversion increased by approximately 1%.
Awards
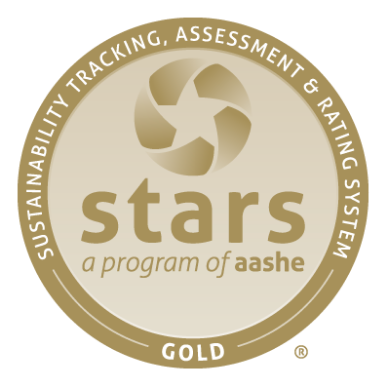
UC Santa Barbara maintains a Gold rating from the Association for the Advancement of Sustainability in Higher Education’s Sustainability Tracking, Assessment and Rating System (AASHE STARS). The report is valid until 2024. This rating system assesses the broad spectrum of sustainability initiatives and programs across campus, with sections covering academics, engagement, operations and public administration. A full list of awards is featured on the UC Office of the President’s website.